Porous glass foam:
Walsh et al. (1965) made measurements on the compressiblity (1/K)
of a porous glass over a wide range of porosities. The samples they
used were fabricated from borosilicate powder die-pressed and then sintered
in alumina crucibles. Depending on the thermal history of the samples, they
obtained porous glass with porosities ranging from 0.70 to near zero.
Porosity measurements were stated to be accurate to ![]() .
.
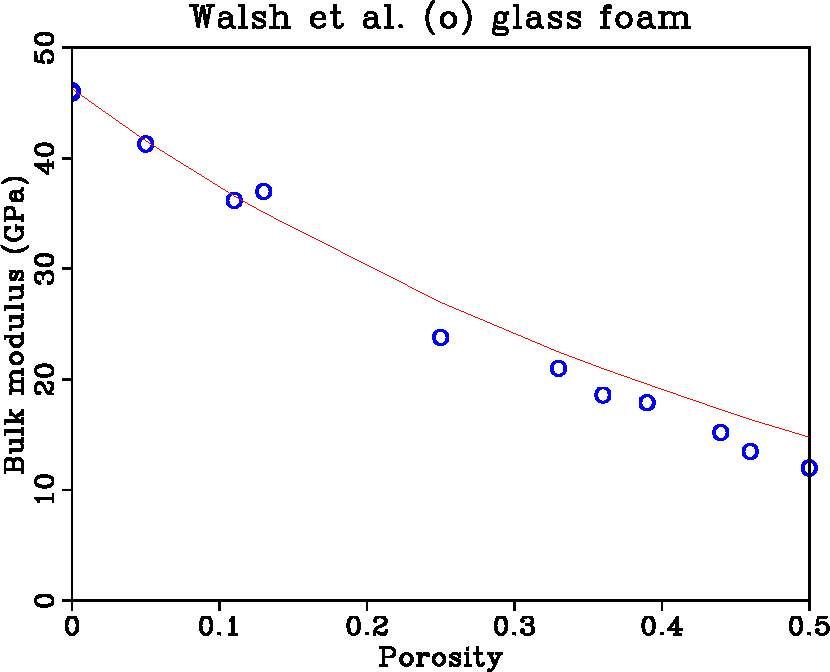
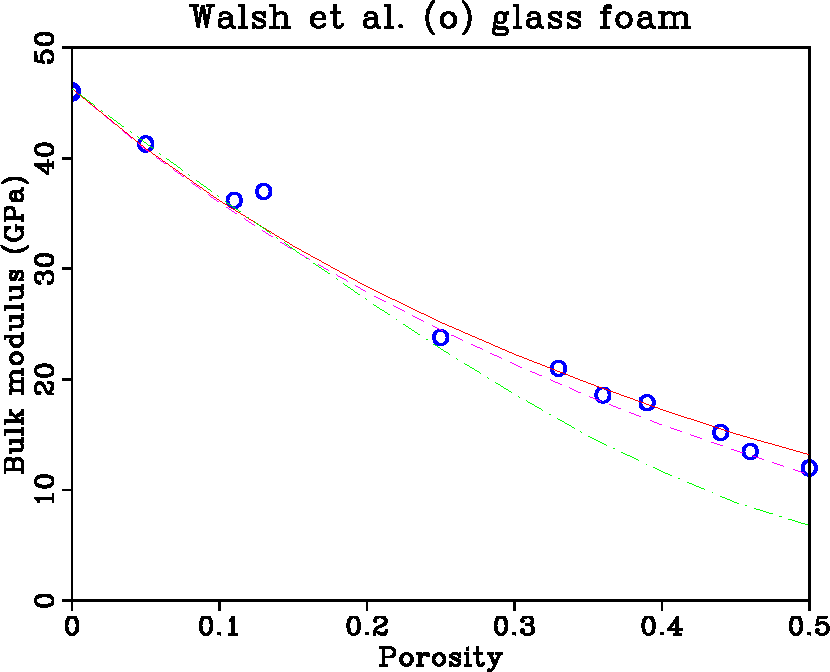
The resulting glass samples were foam, with microgeometry such that large open dry pores were dispersed in a continuous glass background that thinned to a network of needle-like filaments at the highest porosities. Linear compressibility of the samples was measured by Walsh et al. (1965) using electrical resistance strain gages attached to sample surfaces in a high-pressure medium. The two explicit methods under consideration (MT and KT) produce the same estimates for composites with spherical inclusions and Figure 1 shows that these estimates are quite good at lower concentrations of voids, but they serve more as upper bounds than as estimates for the higher concentrations. Ferrari and Filipponi (1991) and Zimmerman (1991) have also demonstrated that the MT method produces good estimates of the compressibilities of these foam samples.
 |
Sintered glass beads:
Synthetic sandstones were made by sintering glass beads made from soda-lime
plate glass at peak temperatures of 700-760![]() C to achieve porosities
of
C to achieve porosities
of ![]() 1-40% (Berge et al., 1993). Samples were cored with
diameters of 2.54
1-40% (Berge et al., 1993). Samples were cored with
diameters of 2.54![]() 0.002 cm and ground to right circular cylinders
with lengths of 2.54
0.002 cm and ground to right circular cylinders
with lengths of 2.54![]() 0.002 cm.
The sample volumes, masses, and glass density were used to compute porosities
with an uncertainty of
0.002 cm.
The sample volumes, masses, and glass density were used to compute porosities
with an uncertainty of ![]() 0.6% for samples with porosities below
0.6% for samples with porosities below
![]() 30%, and an uncertainty of
30%, and an uncertainty of ![]() 1% for the higher porosity samples.
A pulse transmission technique was used with 0.5 MHz P and 5 MHz S
transducers to determine the compressional (P) and shear (S) wave velocities
of both dry and saturated samples. Velocity measurements
had an uncertainty of
1% for the higher porosity samples.
A pulse transmission technique was used with 0.5 MHz P and 5 MHz S
transducers to determine the compressional (P) and shear (S) wave velocities
of both dry and saturated samples. Velocity measurements
had an uncertainty of ![]() 1%.
All measurements were made at atmospheric pressure and room temperature.
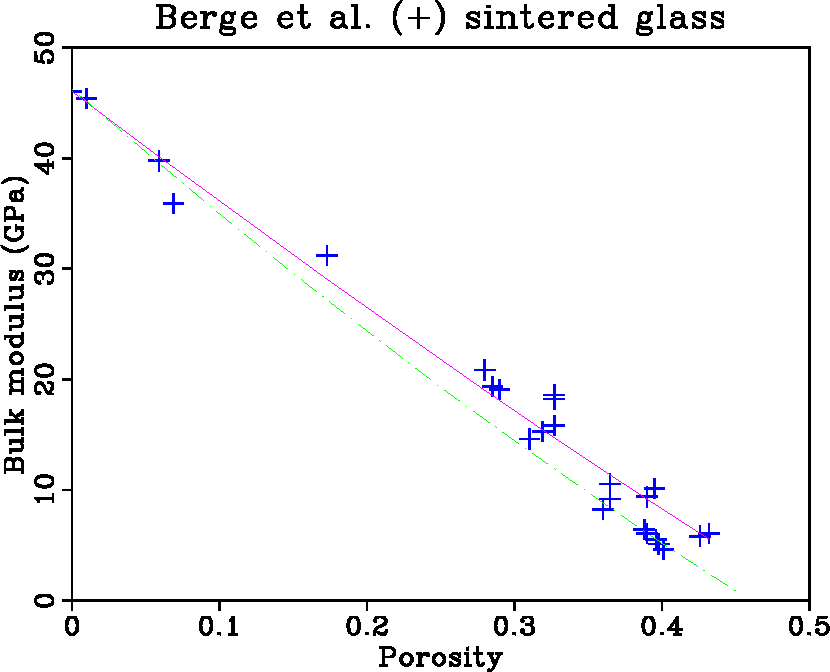
Berge et al. (1993) showed that the SC approximation produced good
estimates of the observed velocities of these synthetic sandstones for all
porosities because the granular structure of these synthetic sandstones is
compatible with this theory. The results of these calculations are
displayed here in Figure 2.
1%.
All measurements were made at atmospheric pressure and room temperature.
Berge et al. (1993) showed that the SC approximation produced good
estimates of the observed velocities of these synthetic sandstones for all
porosities because the granular structure of these synthetic sandstones is
compatible with this theory. The results of these calculations are
displayed here in Figure 2.
 |
 |