

Next: Xtpanel update and future
Up: Introduction
Previous: Xtpanel overview
Using xtpanel from within a seismic processing program offers
some advantages. In the filtering example above, because the entire
process is re-run each time a parameter is changed, a lot of extra
work is done. Each time the RUN button is pressed, the input
dataset (containing a single impulse) is recreated. Then the filter
program must read in the data,
as well as the parameters necessary to run the job. In such a trivial
example, this extra work does not take much time. But in larger
tasks, the extra overhead required to completely re-run a job may
make the interactive performance poor.
To solve this problem, we devised a way to use xtpanel from within
a processing program. After reading in its data and getting set up
to run, a program brings up an xtpanel containing objects that specify
some of the program parameters. Then the program waits for input from
the xtpanel. When input is received, the program executes, and then
waits for additional panel input. Additional panel input causes
the program to be re-run, but without having to do all the overhead
that was done at the start of the program.
The first program to use this interaction is a seismic data cube
viewing program called Cubeplot. Cubeplot displays a perspective
view of a seismic data cube. Displayed on the three faces of the
cube are slices taken from within the data volume. In its standard
batch mode of execution, the user specifies on the command line the
three slices to be shown.
If, on the command line, the user specifies popup=y, then
a panel containing three sliders appears.
As the user changes a slider, a different data
slice is displayed on one of the three cube faces.
The xtpanel script is built into the C language source code
for Cubeplot. Here is the script:
button={ label=Quit action="PRINTQUIT" action=QUIT }
vbox={
  hbox={ name=noborder width=400
    message={ value=axis-1 }
    scrollbar={ label="axis 1" name=pan1 min=0 max=N1 format="%.0f"
      width=300 value=FRAME1
      action="ASSIGN val1 $val"
      action="PRINT frame1=$(pan1) frame2=$(pan2) frame3=$(pan3)"
    }
    message={ name=val1 value=FRAME1  }
  }
  hbox={ name=noborder width=400
    message={ value=axis-2 }
    scrollbar={ label="axis 2" name=pan2 min=0 max=N2 format="%.0f"
      width=300 value=FRAME2
      action="ASSIGN val2 $val"
      action="PRINT frame1=$(pan1) frame2=$(pan2) frame3=$(pan3)"
    }
    message={ name=val2 value=FRAME2  }
  }
  hbox={ name=noborder width=400
    message={ value=axis-3 }
    scrollbar={ label="axis 3" name=pan3 min=0 max=N3 format="%.0f"
      width=300 value=FRAME3
      action="ASSIGN val3 $val"
      action="PRINT frame1=$(pan1) frame2=$(pan2) frame3=$(pan3)"
    }
    message={ name=val3 value=FRAME3  }
  }
}
However, the user can substitute a different script,
containing whatever program parameters are of interest. Here
are the instructions that appear in the on-line program documentation:
popup   Specifying popup=y brings up an xtpanel (if you have xtpanel
	installed) with three sliders. Moving these sliders changes
	the frames plotted on the three cube faces. If you pipe
	the output of Cubeplot to "Xtpen cachepipe=n" you will see
	the display update as the sliders are moved.
	You can specify your own xtpanel script file by doing
	popup_file=filename.
The program then calls two subroutines: popup_start brings up
the xtpanel. This is called after the program's preliminary work
(reading in the input data, getting parameter values, etc.) has been
done. A second routine, popup_check is called after each pass
through processing the data. This routine waits for output from the
xtpanel. It then adds the new output to the table of parsed command
line arguments. I.e. if the user moves a slider and the xtpanel prints
``frame1=100'' then after popup_check it is as though
``frame1=100' had been specified on the command line. When this
routine returns the program reprocesses the data (in the case of
Cubeplot case plotting a new figure) using the new parameters.
Users interested in the details of these routines are referred
to the CD-ROM version of this report, where the source code
for Cubeplot and the popup routines is contained. The most
important point to make about the source is that the modifications
to the Cubeplot program were quite small -- just two subroutine
calls, and a few lines to interpret the new parameter values that
come back from the panel. Interaction can easily be added to
any program in this way.
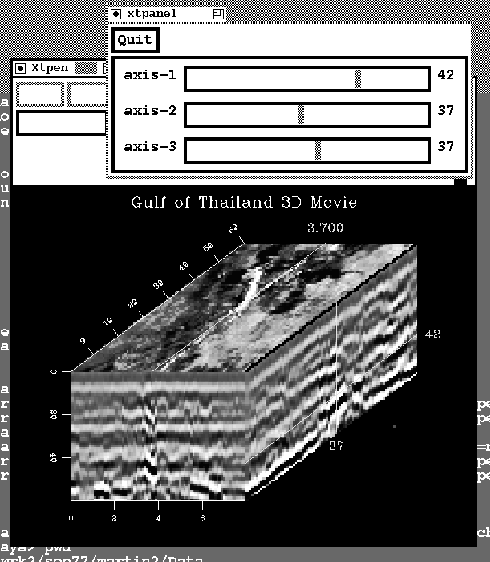
Figure ![[*]](http://sepwww.stanford.edu/latex2html/cross_ref_motif.gif) displays a typical interactive session
using the built-in xtpanel interaction of Cubeplot.
If you are reading the report on CD-ROM, pressing the button
at the end of the figure caption will bring up this example.
Moving the sliders will change the display.
displays a typical interactive session
using the built-in xtpanel interaction of Cubeplot.
If you are reading the report on CD-ROM, pressing the button
at the end of the figure caption will bring up this example.
Moving the sliders will change the display.
It is worth noting that although Cubeplot is a C language program,
the xtpanel popup facility can just as easily be used from
within Fortran and Ratfor programs.
cubeplot
Figure 2 Interactive Cubeplot session using xtpanel. The xtpanel is brought up from within the program. Each time a slider is moved, a subroutine is run to re-draw the image. CD-ROM readers can click on the button at the end of this caption to run Cubeplot.


Next: Xtpanel update and future
Up: Introduction
Previous: Xtpanel overview
Stanford Exploration Project
11/17/1997
![[*]](http://sepwww.stanford.edu/latex2html/cross_ref_motif.gif) displays a typical interactive session
using the built-in xtpanel interaction of Cubeplot.
If you are reading the report on CD-ROM, pressing the button
at the end of the figure caption will bring up this example.
Moving the sliders will change the display.
displays a typical interactive session
using the built-in xtpanel interaction of Cubeplot.
If you are reading the report on CD-ROM, pressing the button
at the end of the figure caption will bring up this example.
Moving the sliders will change the display.
