

Next: Discussion
Up: Introduction
Previous: Synthetic examples
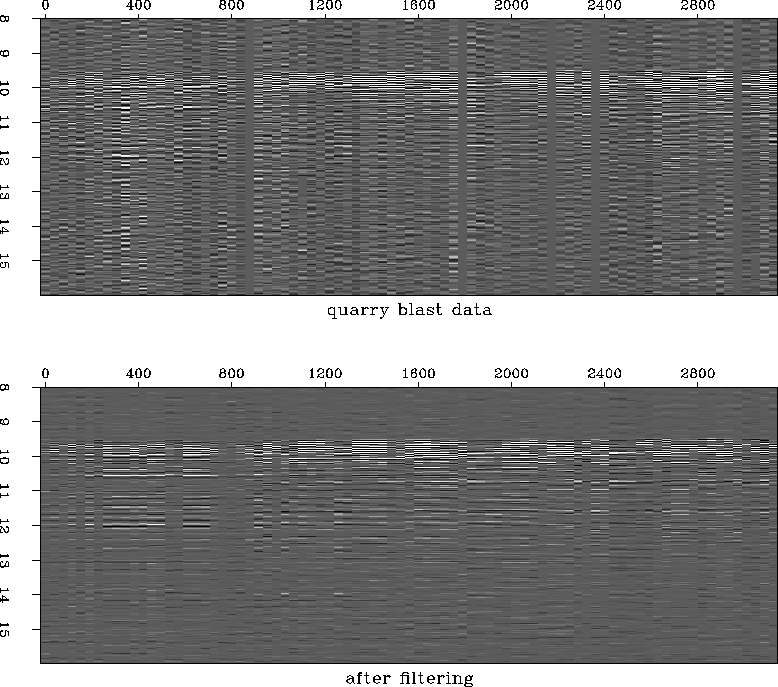
Figure ![[*]](http://sepwww.stanford.edu/latex2html/cross_ref_motif.gif) shows quarry blast data from the SEP passive
experiment. The 3-D data have been plotted here in 2-D, with the
traces sorted by distance from the quarry. The interpolation scheme
has been used to filter random noise, and also as a moveout-dependent
filter, removing energy with apparent velocities less than
4 kilometers/second. In the processed panel on the bottom, steeply
dipping energy corresponding to nearby cultural noise sources has
been removed, and the overall noise reduction has made it easier
to see several weak near-vertically incident arrivals at late times,
corresponding to reflections from layers deep in the crust.
blastint
shows quarry blast data from the SEP passive
experiment. The 3-D data have been plotted here in 2-D, with the
traces sorted by distance from the quarry. The interpolation scheme
has been used to filter random noise, and also as a moveout-dependent
filter, removing energy with apparent velocities less than
4 kilometers/second. In the processed panel on the bottom, steeply
dipping energy corresponding to nearby cultural noise sources has
been removed, and the overall noise reduction has made it easier
to see several weak near-vertically incident arrivals at late times,
corresponding to reflections from layers deep in the crust.
blastint
Figure 7 Quarry blast data before (top) and after (bottom) processing to remove random noise.


Next: Discussion
Up: Introduction
Previous: Synthetic examples
Stanford Exploration Project
11/17/1997

![[*]](http://sepwww.stanford.edu/latex2html/cross_ref_motif.gif) shows quarry blast data from the SEP passive
experiment. The 3-D data have been plotted here in 2-D, with the
traces sorted by distance from the quarry. The interpolation scheme
has been used to filter random noise, and also as a moveout-dependent
filter, removing energy with apparent velocities less than
4 kilometers/second. In the processed panel on the bottom, steeply
dipping energy corresponding to nearby cultural noise sources has
been removed, and the overall noise reduction has made it easier
to see several weak near-vertically incident arrivals at late times,
corresponding to reflections from layers deep in the crust.
shows quarry blast data from the SEP passive
experiment. The 3-D data have been plotted here in 2-D, with the
traces sorted by distance from the quarry. The interpolation scheme
has been used to filter random noise, and also as a moveout-dependent
filter, removing energy with apparent velocities less than
4 kilometers/second. In the processed panel on the bottom, steeply
dipping energy corresponding to nearby cultural noise sources has
been removed, and the overall noise reduction has made it easier
to see several weak near-vertically incident arrivals at late times,
corresponding to reflections from layers deep in the crust.
