 |
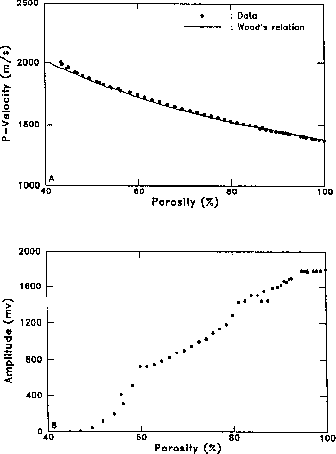
Figure 2 Compressional velocity versus porosity for a suspension of silver-coated glass spheres immersed in sodiumpolytungstate. Experimental data (
Marion 1990 showed that suspensions behave in accord with Wood's velocity-porosity relation. Figure (2) displays in the top panel some experimental results obtained with glass spheres immersed in sodiumpolytungstate. Wood's relation fits the data perfectly down to a porosity of approximately 45 percent. However, the bottom panel shows that the first-peak amplitude of the arriving P-waves decreases drastically when the porosity goes down to 40 percent. This drop in amplitude is caused by the scattering effect of suspended spheres Marion (1990).
 |
In order to verify this idea, I have attempted to model the propagation of P-waves in a rock sample during a lab experiment. The problem with modeling such data is that we are dealing with very high frequencies (1 MHz) and very short distances (centimeters for the model size and fractions of a millimeter for the grains). Since seismic modeling programs are generally used at a completely different scale, care must be taken in the choice of parameters to keep the calculations stable. The 2-D acoustic modeling program used for the experiment, written by J. Etgen, is accurate to the second order in time and the sixteenth order in x and y. The model is 8 centimeters long and large enough to get rid of side reflections. The model itself is composed of two velocities: the velocity of the grains is 3000 ms-1, and the pores are filled with water of velocity 1500 ms-1. The grid spacing is 0.8 mm in both x and y. The velocity distribution in the model is generated randomly in order to achieve a given porosity Popovici and Muir (1989). The input wavelet has a maximum frequency of 600 kHz and a fundamental frequency of 500 kHz. These parameters yield a ratio between the wavelength and the grain size of
| |
(3) |
 |
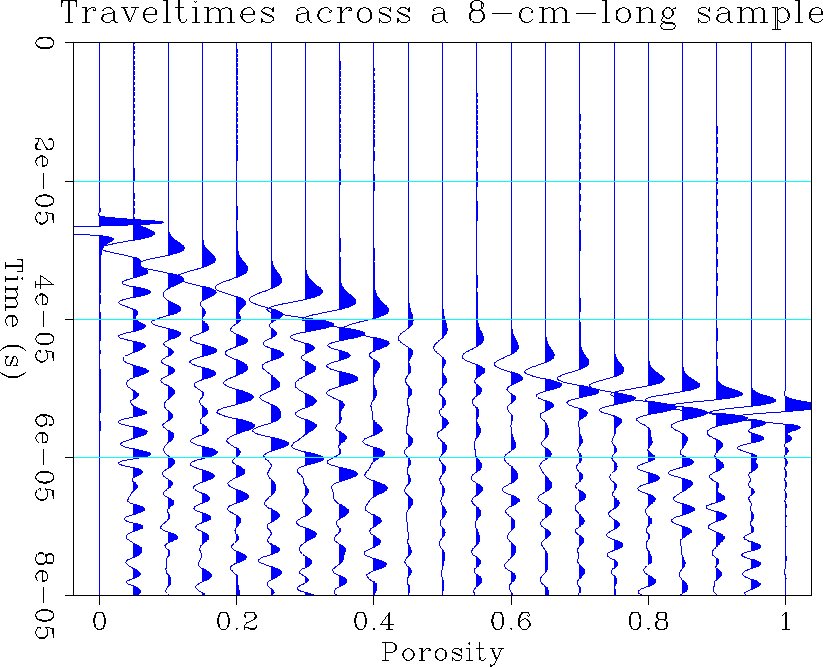
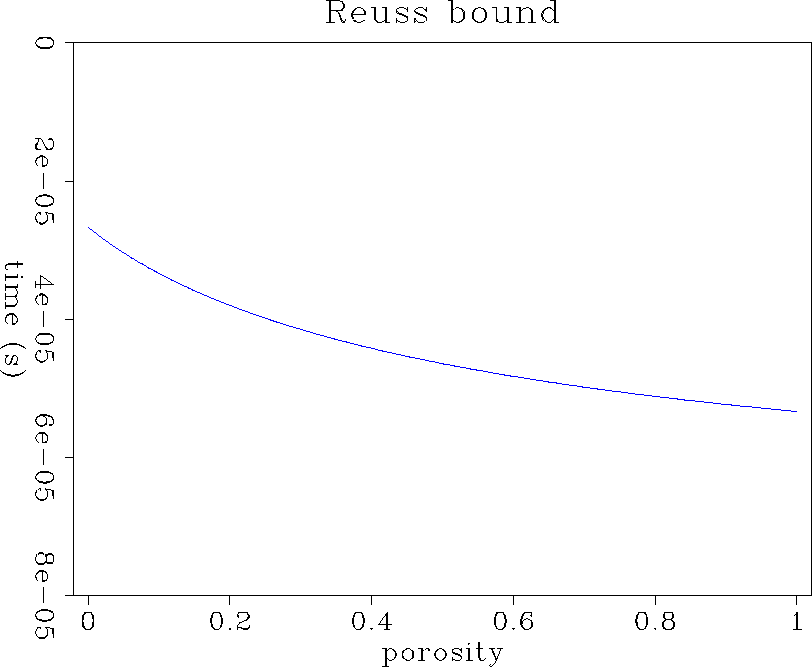
Figure (4) displays the Reuss bound (equivalent to Wood's relation) for the velocities of the model. By mentally overlaying the curve to the synthetic seismogram in Figure (3), we can notice that the first peaks lie close to the curve. Unfortunately, they do not exactly fit the Reuss bound, mainly because the program only models P-velocities.
|
Reuss
Figure 4 Wood's relation for vp1 = 3000 ms-1, vp2 = 1500 ms-1, vs1 = vs2 = 1000 ms-1, and |  |
The interesting part of this modeling is the distribution of amplitudes. The first recorded peak has a large amplitude up to 40 percent porosity. Then the amplitude suddenly drops and starts again to increase slowly in the suspension domain. Thus, its distribution agrees with that shown in the bottom panel of Figure (2).
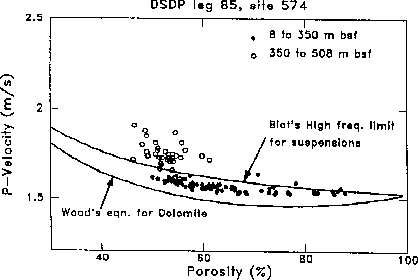
Figure (5) shows how the velocity measurements disagree with Biot's theoretical curves in the region of 50 percent porosity. In this area, the medium is spatially highly varying: there is no large region with the same velocity. Therefore, the region around 50 percent porosity can be seen as the realm of diffraction. Because the diffracted waves travel in a spherical shape, they decay rapidly in amplitude. It is very hard to measure the velocity of such media because the amplitudes are very weak and we do not see the strong arrival caused by waves traveling through areas of constant velocity. Looking more closely at the synthetic seismogram, we can see that the strongest arrivals are not the first arrivals. Even when the porosity is close to unity, some small-amplitude precursors can be seen on the seismogram, attesting to the occurrence of some diffraction that allows shorter traveltimes but yields weaker amplitudes.
 |
We can conclude from these observations that the velocities measured in the realm of diffraction are closer to the average velocity across the medium than to the theoretical velocities predicted by Wood's and Biot's relations. But the important point is that the first peak is very hard to determine during the measurement and there is a high chance of being wrong.