


Wang (1988) measured the wave velocities of Boise and Beaver sandstones when saturated with four different hydrocarbons, as well as when saturated with water and when air dry. The four hydrocarbons used were n-heptane (C7H16), 1-decene (C10H20), 1-tetradecene (C14H28), and 1-octadecene (C18H36). n-Heptane is an alkane, while the other three hydrocarbons are alkenes. The results of these ultrasonic measurements (made with wideband transducers having a center frequency of 2.25 MHz) are summarized in Table 1. We excluded one of the hydrocarbons (the alkane) from this analysis because it had virtually the same compressibility as that of 1-octadecene.
The Boise sandstone has high porosity (![]() ) and high permeability
(
) and high permeability
(![]() mD), while the Beaver sandstone has lower porosity (
mD), while the Beaver sandstone has lower porosity (![]() )and also much lower permeability (not measured for this sample, but other
samples of Beaver sandstone have
)and also much lower permeability (not measured for this sample, but other
samples of Beaver sandstone have ![]() mD).
mD).
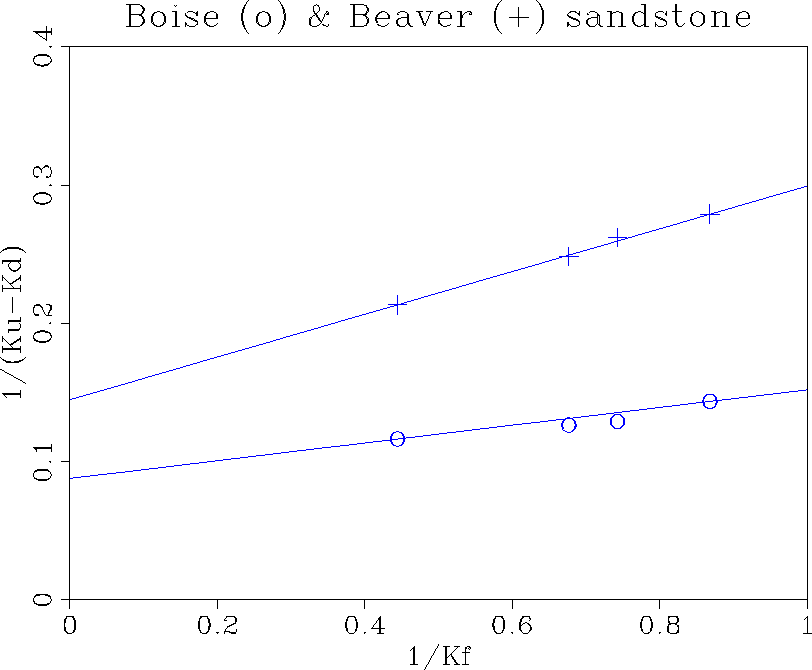
Using the data from Table 1, we plot 1/(Ku-Kd) versus ![]() in
Figure 2 to check whether the data fall on a straight line as
predicted by Eq.(linearfit). It is encouraging to see that the
data do indeed seem to fall on a straight line. However, when we take a
closer look and consider the values of the slopes of these lines, we find that
the slope for Boise sandstone is
in
Figure 2 to check whether the data fall on a straight line as
predicted by Eq.(linearfit). It is encouraging to see that the
data do indeed seem to fall on a straight line. However, when we take a
closer look and consider the values of the slopes of these lines, we find that
the slope for Boise sandstone is ![]() , while that for
Beaver is
, while that for
Beaver is ![]() . Since Eq.(b) shows that
. Since Eq.(b) shows that ![]() and it is well-known that
and it is well-known that ![]() , then recalling that the
porosities of these samples were measured to be
, then recalling that the
porosities of these samples were measured to be ![]() and
and
![]() respectively, we find the paradoxical result that the
data fall on a straight line, but it is the wrong straight line!
The theory shows that we should expect these slopes to be somewhat larger
than the measured porosities, but instead they are either substantially
smaller or somewhat smaller in these two examples. Possible resolutions
of this paradox will be the subject of the following discussion.
respectively, we find the paradoxical result that the
data fall on a straight line, but it is the wrong straight line!
The theory shows that we should expect these slopes to be somewhat larger
than the measured porosities, but instead they are either substantially
smaller or somewhat smaller in these two examples. Possible resolutions
of this paradox will be the subject of the following discussion.
 |


