


The objective of data compression is to store information efficiently. Some conservative data compression schemes achieve this compression without changing the input data. Other approaches reduce the data down to their essential features and store only those features. Obviously, for such a compression to be successful, the correct reduction or filter step must be used. The correct filter preserves the data features which we consider essential.
Data compression by wavelet transformation is accomplished by storing the location of the significant samples and omitting the insignificant values. In practice a hybrid method is often used. The values and location of the maximum samples are stored. Intermediate sized sample values are stored by one- or two-bit representation of their value. Sample values below a certain threshold are neglected. In this project I did not store the actual sample values, because I was primarily interested in the effects of filtering in the wavelet domain.
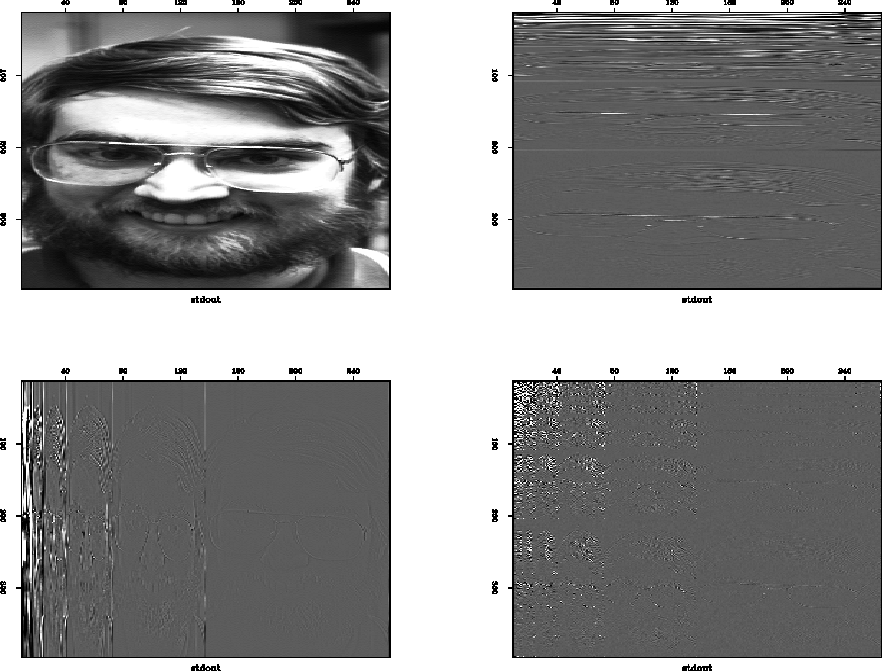
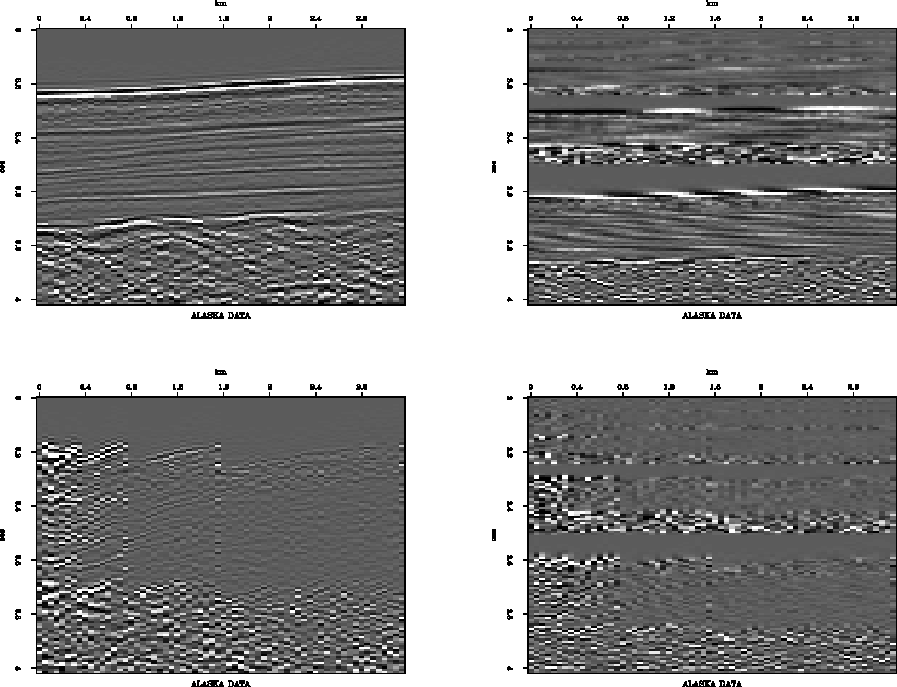
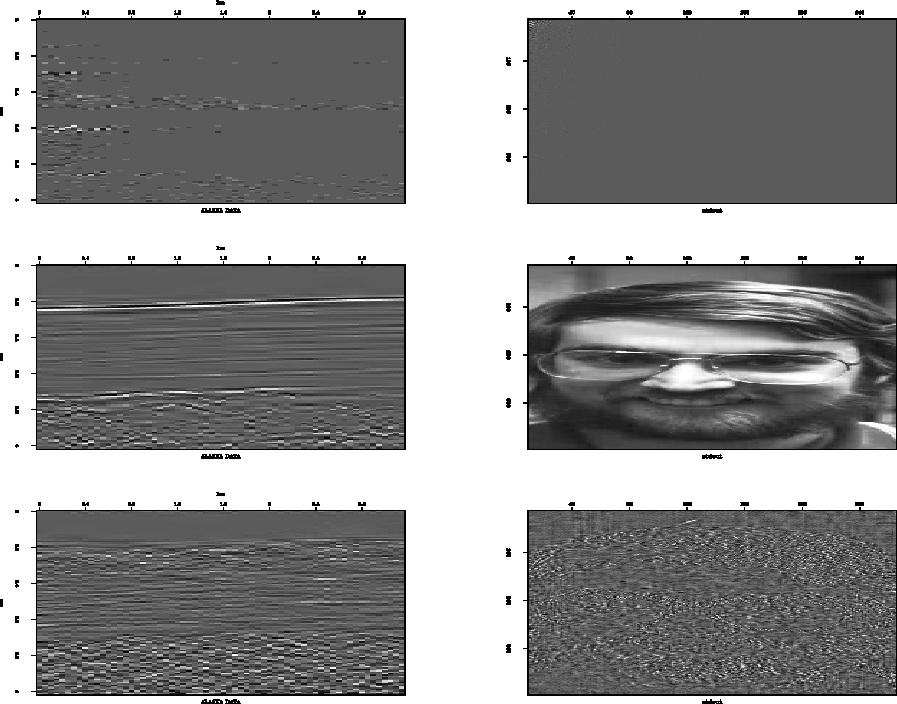
In wavelet compression the input data are transformed and small sample values are neglected. In Figures 7 and 8, I have erased all samples smaller than 10 % of the maximum value. This leaves only about 8 % of the samples as nonzero.
The purpose of a video telephone picture of a person is to be recognizable. Little details are often negligible. The reduction step can be tested by interviewing users about their satisfaction. However, for seismic data it is hard to decide which details might be of importance in latter interpretation. Without a clear definition of what we want to preserve, a data compression by reduction cannot finally be evaluated.
Data which depict a sparse wavelet transform are suited for compression by DWT. In Figure 7 the photograph's wide, smooth areas like the forehead and the cheeks are bounded by edges such as the hair line or the facial oval. The data yield a fairly sparse wavelet transform. Only few detail coefficients corresponding to the edges are of substantial size. Unfortunately, seismic data do not yield such a sparse matrix. Zeroing values below the 10 % threshold leaves the data severely distorted as seen in Figure 8. Seismic velocity spectra or well logs might be more suitable for compression by wavelet transformation.
 |


 |
 |