

Next: Conclusions
Up: Karrenbach, Nichols & Muir:
Previous: AMPLITUDE EXTRACTION
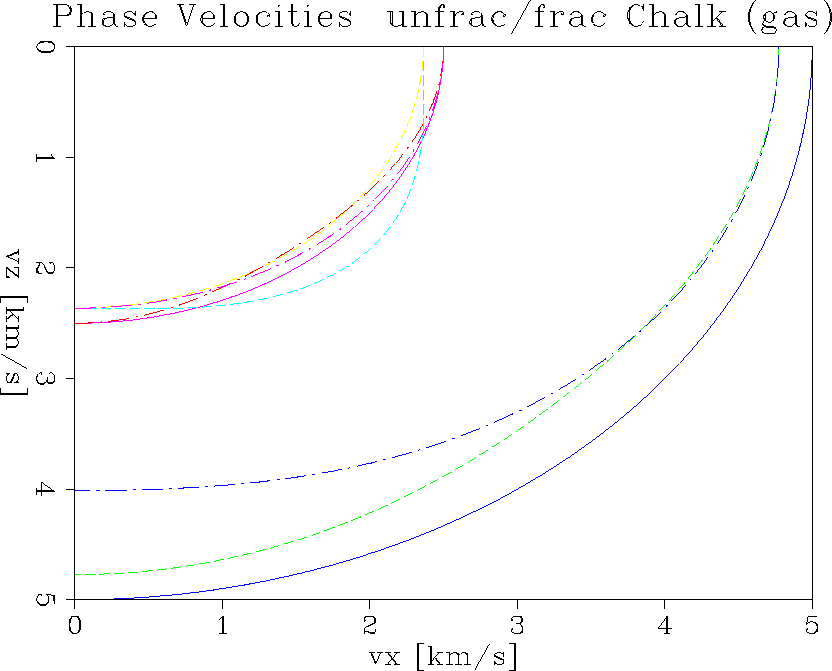
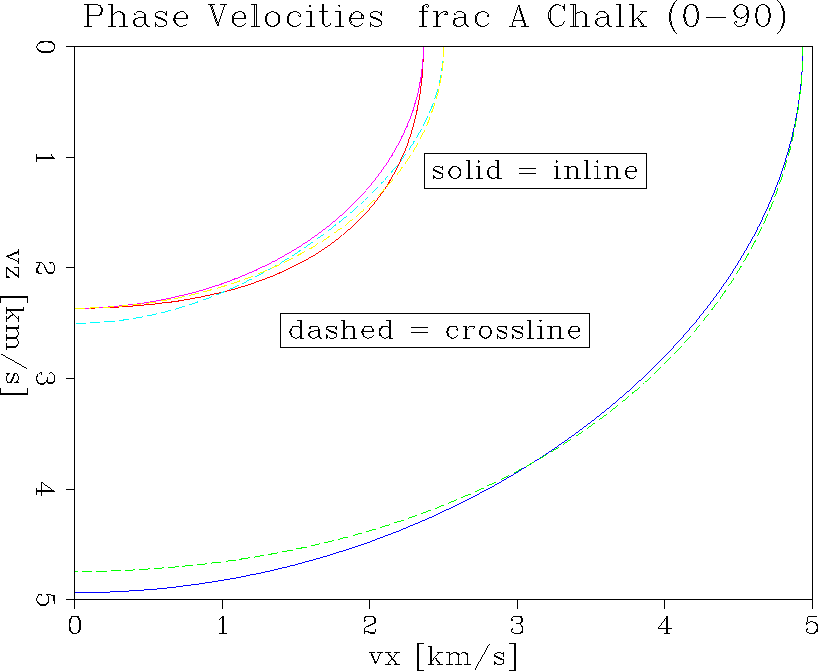
Using S&M group theory to add fractures to the chalk matrix, we obtain
the phase velocity curves in Figure ![[*]](http://sepwww.stanford.edu/latex2html/cross_ref_motif.gif) as polar plots.
The fractures are vertical and have constant azimuth along the inline
direction. So we have a preferred inline-fracture orientation with a
horizontal axis of symmetry.
Examine just the resulting P-wave velocity.
The solid line is the unfractured chalk velocity and it shows an isotropic
response. Looking at the neighboring dashed lines, the fractured P velocities
(4-5 km/s), the inline
and crossline velocities coincide for purely horizontal propagation
and up to
45 degrees from the horizontal. The discrepancy increases from there on and
for purely vertical propagation until
the inline and crossline differences reach a
magnitude of 0.8 km/s. The shear waves exhibit similar behaviour, but the
magnitude of those effects are generally smaller. Reflection amplitude
behaviour at the interface will depend on both the stiffnesses above and below.
So even if we see a strong anisotropy in velocity in one medium,
there is still no guarantee that we will get a strong reflection amplitude anisotropy,
since the other medium could vary in the same manner and the differences
could be small.
as polar plots.
The fractures are vertical and have constant azimuth along the inline
direction. So we have a preferred inline-fracture orientation with a
horizontal axis of symmetry.
Examine just the resulting P-wave velocity.
The solid line is the unfractured chalk velocity and it shows an isotropic
response. Looking at the neighboring dashed lines, the fractured P velocities
(4-5 km/s), the inline
and crossline velocities coincide for purely horizontal propagation
and up to
45 degrees from the horizontal. The discrepancy increases from there on and
for purely vertical propagation until
the inline and crossline differences reach a
magnitude of 0.8 km/s. The shear waves exhibit similar behaviour, but the
magnitude of those effects are generally smaller. Reflection amplitude
behaviour at the interface will depend on both the stiffnesses above and below.
So even if we see a strong anisotropy in velocity in one medium,
there is still no guarantee that we will get a strong reflection amplitude anisotropy,
since the other medium could vary in the same manner and the differences
could be small.
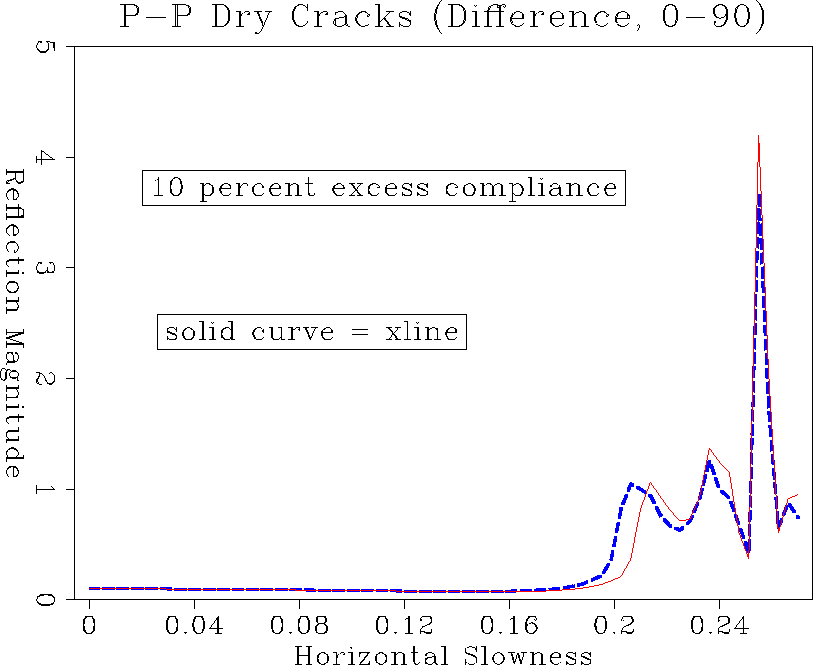
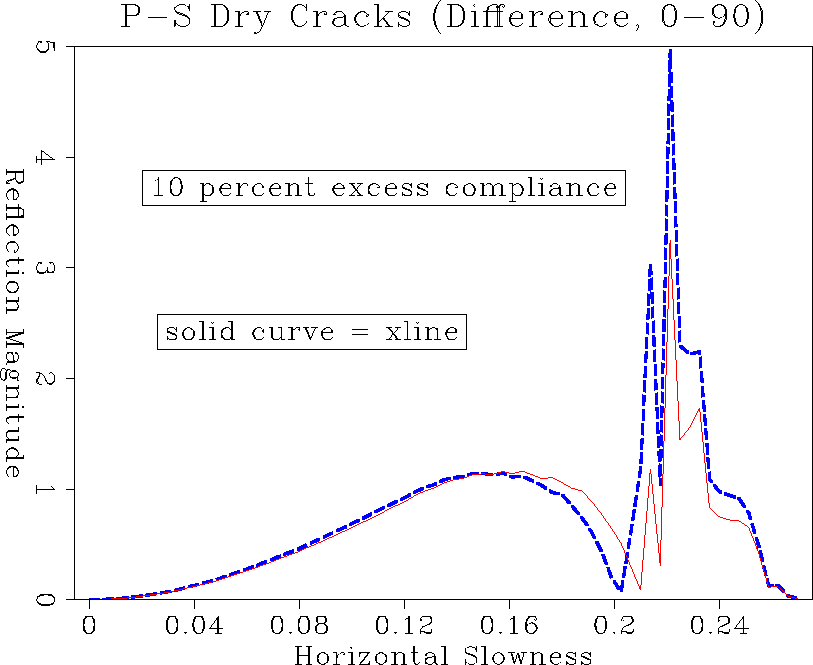
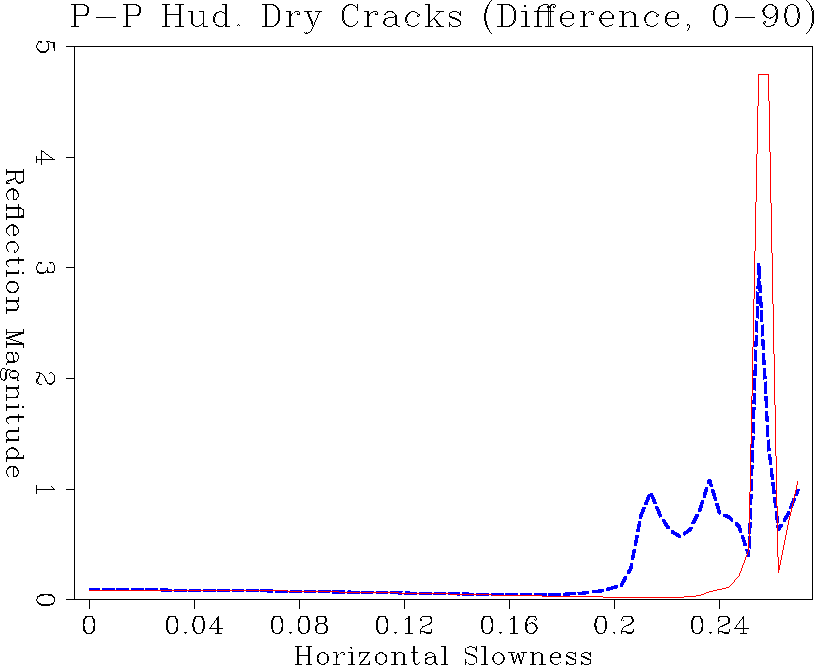
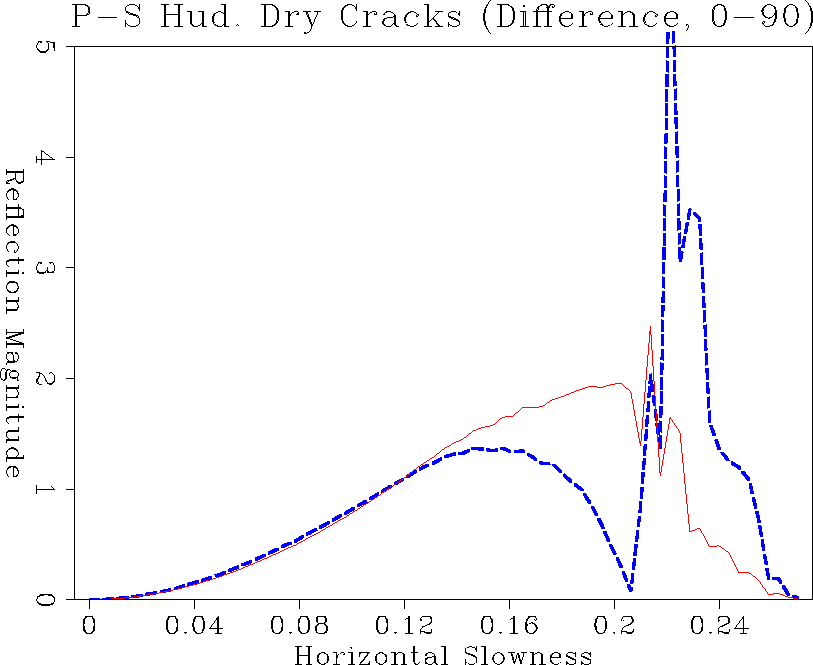
Figures ![[*]](http://sepwww.stanford.edu/latex2html/cross_ref_motif.gif) and
and ![[*]](http://sepwww.stanford.edu/latex2html/cross_ref_motif.gif) show inline and
crossline reflection amplitude comparisons. Very small differences
exist for the PP reflection angles less than the critical angle.
Approaching the critical angle, the reflection amplitudes show
distinct changes between inline and crossline behaviour. The same is
true for the PS reflection with the differences showing up at even
smaller propagation angles. The most important effect, however, is
the azimuthal change in critical angle. If we had designed an
experiment to record out to the PS critical angle, that would give us
the clearer information about anisotropy. However, for targets of
interest one usually has precritical amplitudes available. Figures
show inline and
crossline reflection amplitude comparisons. Very small differences
exist for the PP reflection angles less than the critical angle.
Approaching the critical angle, the reflection amplitudes show
distinct changes between inline and crossline behaviour. The same is
true for the PS reflection with the differences showing up at even
smaller propagation angles. The most important effect, however, is
the azimuthal change in critical angle. If we had designed an
experiment to record out to the PS critical angle, that would give us
the clearer information about anisotropy. However, for targets of
interest one usually has precritical amplitudes available. Figures
![[*]](http://sepwww.stanford.edu/latex2html/cross_ref_motif.gif) and
and ![[*]](http://sepwww.stanford.edu/latex2html/cross_ref_motif.gif) tell us that the
mode converted PS wave has a better chance in estimating the magnitude
of anisotropy. Figure
tell us that the
mode converted PS wave has a better chance in estimating the magnitude
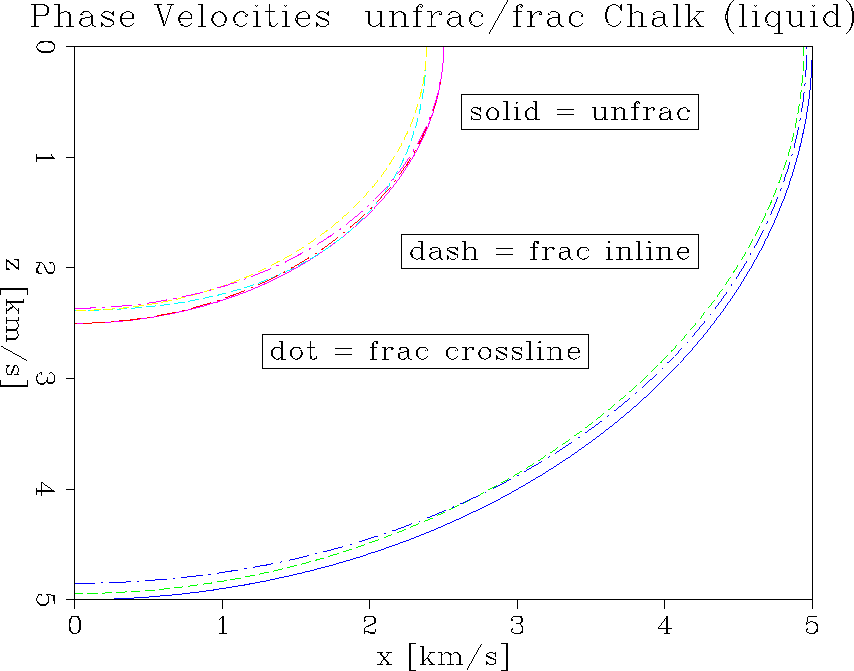
of anisotropy. Figure ![[*]](http://sepwww.stanford.edu/latex2html/cross_ref_motif.gif) shows again phase velocity
curves as a scalar plot. These plots differ from Figure
shows again phase velocity
curves as a scalar plot. These plots differ from Figure ![[*]](http://sepwww.stanford.edu/latex2html/cross_ref_motif.gif) in that the cracks are now fluid filled, while before they were unfilled voids;
they show a decrease in the difference of the velocity curves.
in that the cracks are now fluid filled, while before they were unfilled voids;
they show a decrease in the difference of the velocity curves.
Figures ![[*]](http://sepwww.stanford.edu/latex2html/cross_ref_motif.gif) and
and
![[*]](http://sepwww.stanford.edu/latex2html/cross_ref_motif.gif) are computed
by incorporating not just a bulk excess compliance, but Hudson's approximation
expressed in the S&M group domain Nichols (1989).
These two pictures show for the PP
azimuthal amplitude only small differences close to the critical angle, but the
PS difference is now more pronounced, also influencing the position of the
critical angle slightly.
are computed
by incorporating not just a bulk excess compliance, but Hudson's approximation
expressed in the S&M group domain Nichols (1989).
These two pictures show for the PP
azimuthal amplitude only small differences close to the critical angle, but the
PS difference is now more pronounced, also influencing the position of the
critical angle slightly.
Hudson's theory allows the variation of three parameters: the
aspect ratio, the stiffness of the filling material, and the volume density of
cracks. In the following examples, the crack
filling material stiffness (a fluid)
is maintained constant.
First we consider a large aspect ratio and medium volume density.
This model is an extreme example, and pushes the validity of our crack model.
The P-wave sees a different bulk modulus, especially when compared to
Figure ![[*]](http://sepwww.stanford.edu/latex2html/cross_ref_motif.gif) .
Figure
.
Figure ![[*]](http://sepwww.stanford.edu/latex2html/cross_ref_motif.gif) shows the corresponding
polar plots of phase velocity curves. The solid lines denote inline velocity
curves. Comparing the P-wave velocities inline and crossline, we see no
difference for horizontal propagation but some differences at other angles.
The difference reverses sign along the propagation curve and is largest for
near vertical propagation. The S-wave propagation exhibits somewhat different
behaviour, but the effects are of similar magnitude.
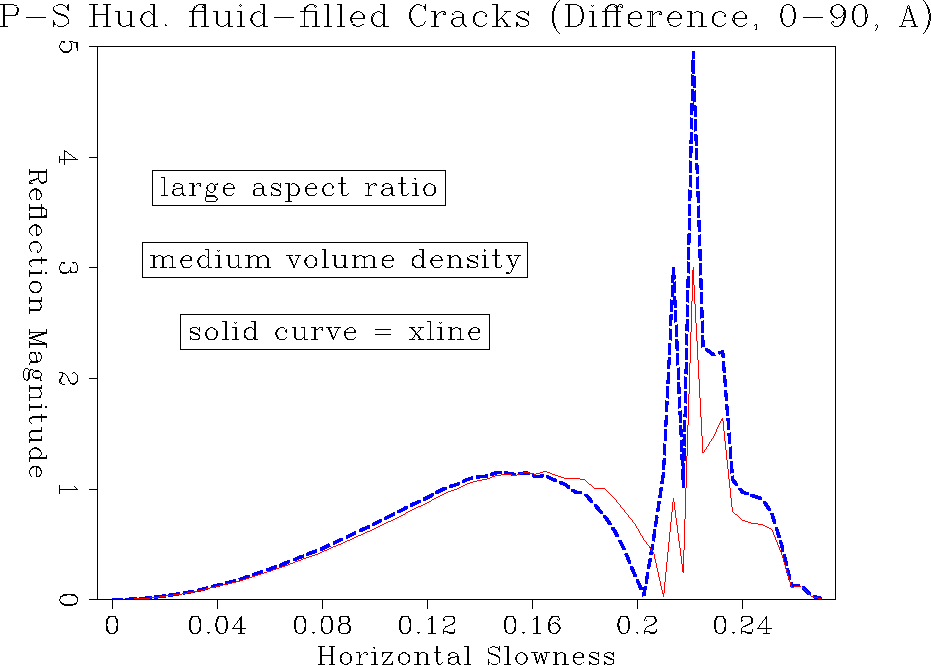
PP amplitude differences mainly show up near the PS critical angle. In the
PS mode converted wave, we see the inline-crossline amplitude difference
changing sign going from near vertical to PS critical angle propagation.
We would expect this since the phase velocity curves crossing over in
Figure
shows the corresponding
polar plots of phase velocity curves. The solid lines denote inline velocity
curves. Comparing the P-wave velocities inline and crossline, we see no
difference for horizontal propagation but some differences at other angles.
The difference reverses sign along the propagation curve and is largest for
near vertical propagation. The S-wave propagation exhibits somewhat different
behaviour, but the effects are of similar magnitude.
PP amplitude differences mainly show up near the PS critical angle. In the
PS mode converted wave, we see the inline-crossline amplitude difference
changing sign going from near vertical to PS critical angle propagation.
We would expect this since the phase velocity curves crossing over in
Figure ![[*]](http://sepwww.stanford.edu/latex2html/cross_ref_motif.gif) .
Again the PS critical angle is shifted with respect to the inline angle.
.
Again the PS critical angle is shifted with respect to the inline angle.
Next we consider in Figure ![[*]](http://sepwww.stanford.edu/latex2html/cross_ref_motif.gif) a chalk and go to the
other extreme, compared to Figure
a chalk and go to the
other extreme, compared to Figure ![[*]](http://sepwww.stanford.edu/latex2html/cross_ref_motif.gif) and crack it with a small aspect ratio, but giving
a large volume density of fluid-filled cracks. We have many long, thin
fluid-filled cracks (Fig.
and crack it with a small aspect ratio, but giving
a large volume density of fluid-filled cracks. We have many long, thin
fluid-filled cracks (Fig. ![[*]](http://sepwww.stanford.edu/latex2html/cross_ref_motif.gif) ). The large crack volume density
lets us expect that the P-wave can traverse the chalk matrix
relatively unobstructed in any direction (less azimuthal dependence).
The shear wave however sees more displacement discontinuities due to the
fluid inclusion over a much greater range of angles.
For Figure
). The large crack volume density
lets us expect that the P-wave can traverse the chalk matrix
relatively unobstructed in any direction (less azimuthal dependence).
The shear wave however sees more displacement discontinuities due to the
fluid inclusion over a much greater range of angles.
For Figure
![[*]](http://sepwww.stanford.edu/latex2html/cross_ref_motif.gif) , the P-waves show only minor azimuthal differences at medium
propagation angles. The PP reflection amplitude in Figure
, the P-waves show only minor azimuthal differences at medium
propagation angles. The PP reflection amplitude in Figure
![[*]](http://sepwww.stanford.edu/latex2html/cross_ref_motif.gif) shows hardly any differences inline and crossline.
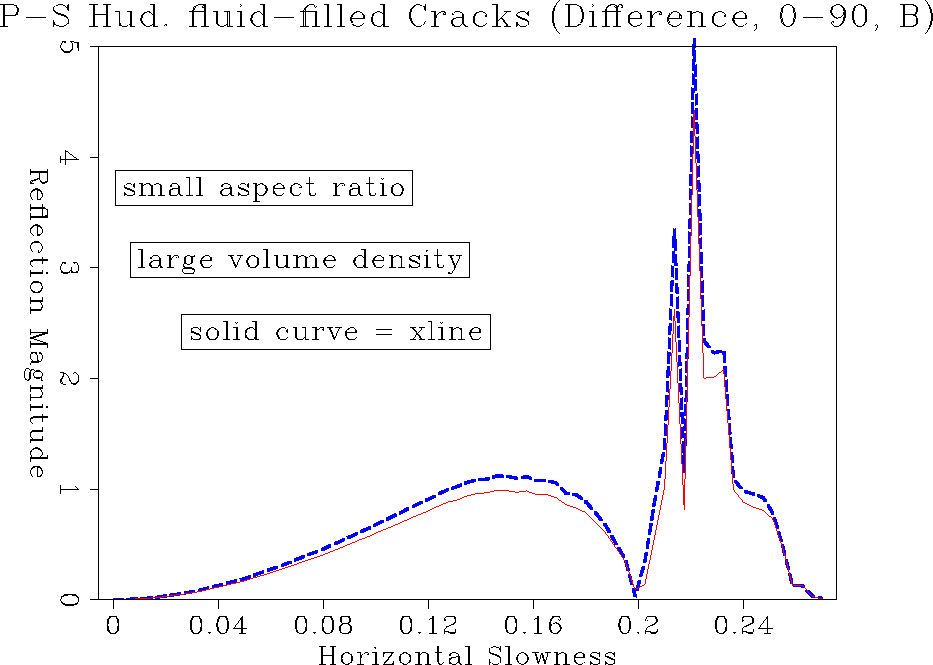
The PS converted mode (Figure
shows hardly any differences inline and crossline.
The PS converted mode (Figure ![[*]](http://sepwww.stanford.edu/latex2html/cross_ref_motif.gif) ),
however, shows more variability, with the differences
now exhibiting a constant sign for all angles.
Most importantly we recognize that
the critical angle stays the same for inline and crossline experiments.
In that case the PS critical angle does not give us any information about
anisotropy.
),
however, shows more variability, with the differences
now exhibiting a constant sign for all angles.
Most importantly we recognize that
the critical angle stays the same for inline and crossline experiments.
In that case the PS critical angle does not give us any information about
anisotropy.
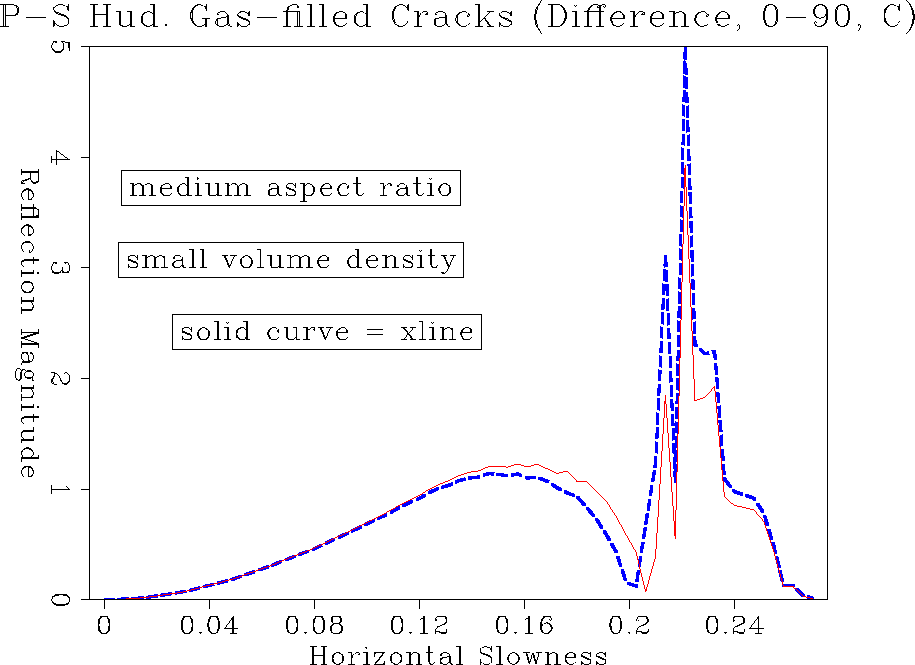
The final example is a chalk matrix with a medium aspect ratio and a small
volume density of cracks (Figure ![[*]](http://sepwww.stanford.edu/latex2html/cross_ref_motif.gif) ).
This is well within the validity limits of the
theory. For fluid inclusion the reflection amplitudes in
Figure
).
This is well within the validity limits of the
theory. For fluid inclusion the reflection amplitudes in
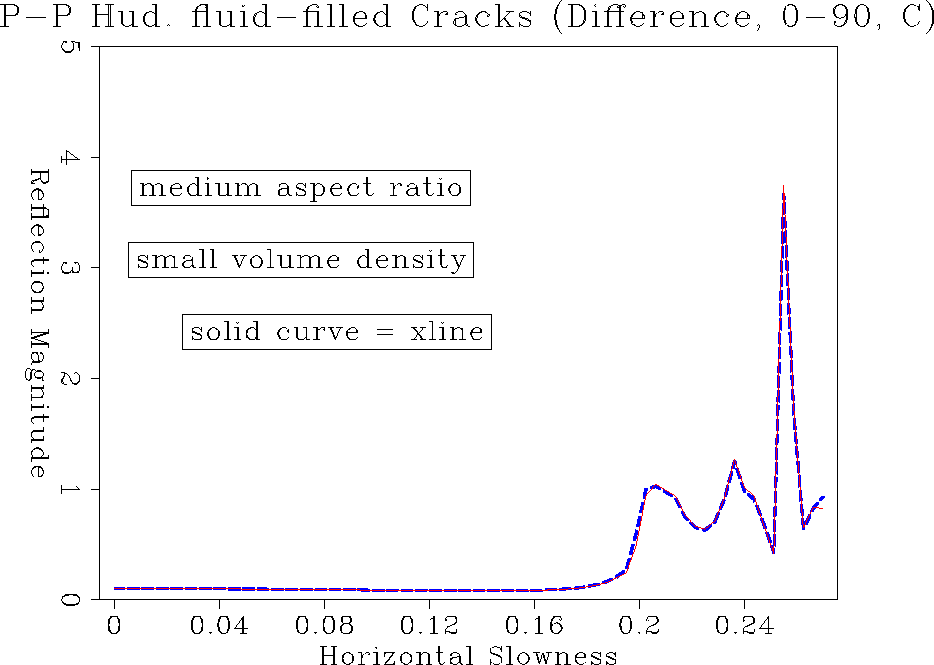
Figure ![[*]](http://sepwww.stanford.edu/latex2html/cross_ref_motif.gif) and
and ![[*]](http://sepwww.stanford.edu/latex2html/cross_ref_motif.gif) show hardly any sign of azimuthal amplitude variation.
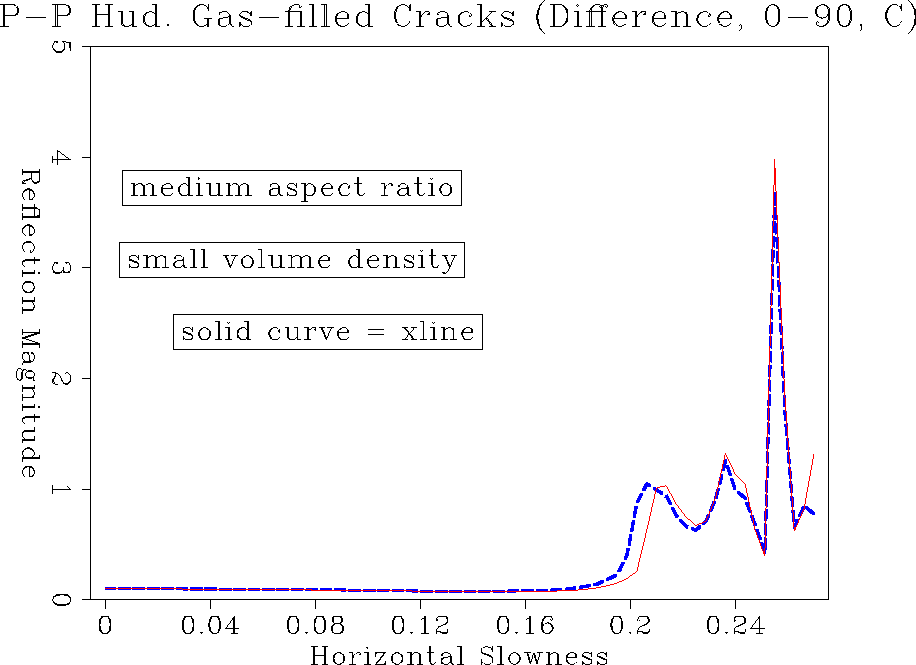
With a gas filling, the difference between
inline and crossline appears again for PP as well as for converted mode PS
reflections. The PS critical angle is shifted from inline to crossline.
In this sense, discrimination between gas and fluid-filled cracks
may be possible, but the ability to distinguish anisotropic
from an isotropic behaviour
is not guaranteed by looking only at inline and crossline experiments.
show hardly any sign of azimuthal amplitude variation.
With a gas filling, the difference between
inline and crossline appears again for PP as well as for converted mode PS
reflections. The PS critical angle is shifted from inline to crossline.
In this sense, discrimination between gas and fluid-filled cracks
may be possible, but the ability to distinguish anisotropic
from an isotropic behaviour
is not guaranteed by looking only at inline and crossline experiments.
comp.f10.pp.tp
Figure 11 PP reflection amplitude comparing inline and crossline.
 comp.f10.ps.tp
Figure 12 PS reflection amplitude comparing inline and crossline.
 vel.unfrac.gas
Figure 13 Velocity comparison for inline, and crossline for all three wave types.
 vel.unfrac.wet
Figure 14 Velocity comparison for inline, and crossline for all three wave types.
 comp.f10.huddry.pp.tp
Figure 15 PP reflection amplitude comparison inline and crossline for dry cracks. Excess compliance was added using S&M formalism to generate vertical cracks.
 comp.f10.huddry.ps.tp
Figure 16 PS reflection amplitude comparison inline and crossline for dry cracks. Excess compliance was added using S&M formalism to generate vertical cracks.
 vel.A
vel.A
Figure 17 Phase velocity comparison for all wave types, inline and crossline. Fracture parameters are large aspect ratio and medium volume density.
 comp.A.hudwet.pp.tp
Figure 18 PP reflection amplitude comparison of inline and crossline for fluid-filled cracks.
 comp.A.hudwet.ps.tp
Figure 19 PS reflection amplitude comparison of inline and crossline for fluid-filled cracks.
 vel.B
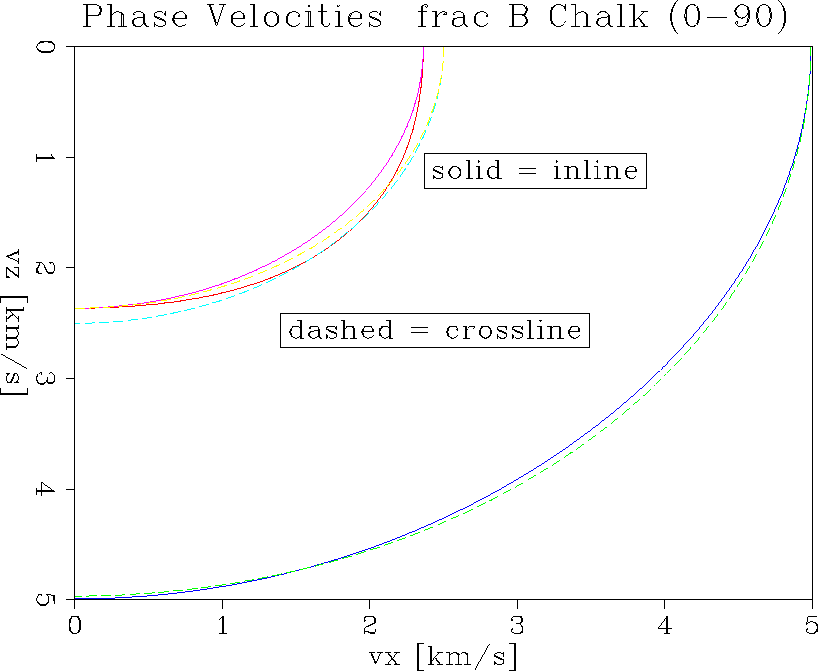
vel.B
Figure 20 Phase velocity comparison for all wave types, inline and crossline. Fracture parameters are small aspect ratio and large volume density.
 comp.B.hudwet.pp.tp
Figure 21 PP reflection amplitude comparison of inline and crossline for fluid-filled cracks type B.
 comp.B.hudwet.ps.tp
Figure 22 PS reflection amplitude comparison of inline and crossline for fluid-filled cracks type B.
 vel.C
vel.C
Figure 23 Phase velocity comparison for all wave types, inline and crossline. Fracture parameters are medium aspect ratio and small volume density.
 comp.C.hudwet.pp.tp
Figure 24 PP reflection amplitude comparison of inline and crossline for fluid-filled cracks of type C.
 comp.C.hudwet.ps.tp
Figure 25 PS reflection amplitude comparison of inline and crossline for fluid-filled cracks of type C.
 comp.C.huddry.pp.tp
Figure 26 PP reflection amplitude comparison of inline and crossline for dry cracks type of C.
 comp.C.huddry.ps.tp
Figure 27 PS reflection amplitude comparison of inline and crossline for dry cracks type of C.

As shown by the above examples, we can give some estimation of the
crack content and distribution by looking at azimuthal variation of
reflection amplitudes. This analysis is different from just looking at
constant azimuth reflection amplitudes, as is done in ``conventional'' 2-D AVO
studies. In such constant azimuth studies, the search for anisotropy
does not make much sense. We can always model the anisotropic AVO
beautifully, but the problem lies in the inverse process, namely to
estimate anisotropy from constant azimuth AVO. In that case an
isotropic equivalent medium can give the same answer for a surface
seismic experiment as an anisotropic medium. In this paper we have
looked only at azimuthal variations and not at the ``absolute'' AVO
behaviour. All our measurements are with respect to a fixed azimuth,
that serves as a reference. Variations from that reference can
indicate anisotropy due to fracture orientation and fracture content.
The numerical modeling examples we showed above should be taken as a
lower crack density bound, since they are based on a small volume density of
cracks. Austin chalk may exhibit stronger fracturing in reality.


Next: Conclusions
Up: Karrenbach, Nichols & Muir:
Previous: AMPLITUDE EXTRACTION
Stanford Exploration Project
11/17/1997
![[*]](http://sepwww.stanford.edu/latex2html/cross_ref_motif.gif) as polar plots.
The fractures are vertical and have constant azimuth along the inline
direction. So we have a preferred inline-fracture orientation with a
horizontal axis of symmetry.
Examine just the resulting P-wave velocity.
The solid line is the unfractured chalk velocity and it shows an isotropic
response. Looking at the neighboring dashed lines, the fractured P velocities
(4-5 km/s), the inline
and crossline velocities coincide for purely horizontal propagation
and up to
45 degrees from the horizontal. The discrepancy increases from there on and
for purely vertical propagation until
the inline and crossline differences reach a
magnitude of 0.8 km/s. The shear waves exhibit similar behaviour, but the
magnitude of those effects are generally smaller. Reflection amplitude
behaviour at the interface will depend on both the stiffnesses above and below.
So even if we see a strong anisotropy in velocity in one medium,
there is still no guarantee that we will get a strong reflection amplitude anisotropy,
since the other medium could vary in the same manner and the differences
could be small.
as polar plots.
The fractures are vertical and have constant azimuth along the inline
direction. So we have a preferred inline-fracture orientation with a
horizontal axis of symmetry.
Examine just the resulting P-wave velocity.
The solid line is the unfractured chalk velocity and it shows an isotropic
response. Looking at the neighboring dashed lines, the fractured P velocities
(4-5 km/s), the inline
and crossline velocities coincide for purely horizontal propagation
and up to
45 degrees from the horizontal. The discrepancy increases from there on and
for purely vertical propagation until
the inline and crossline differences reach a
magnitude of 0.8 km/s. The shear waves exhibit similar behaviour, but the
magnitude of those effects are generally smaller. Reflection amplitude
behaviour at the interface will depend on both the stiffnesses above and below.
So even if we see a strong anisotropy in velocity in one medium,
there is still no guarantee that we will get a strong reflection amplitude anisotropy,
since the other medium could vary in the same manner and the differences
could be small.
