

Next: CONCLUSION
Up: A MARINE DATA EXAMPLE
Previous: Monte Carlo velocity picks
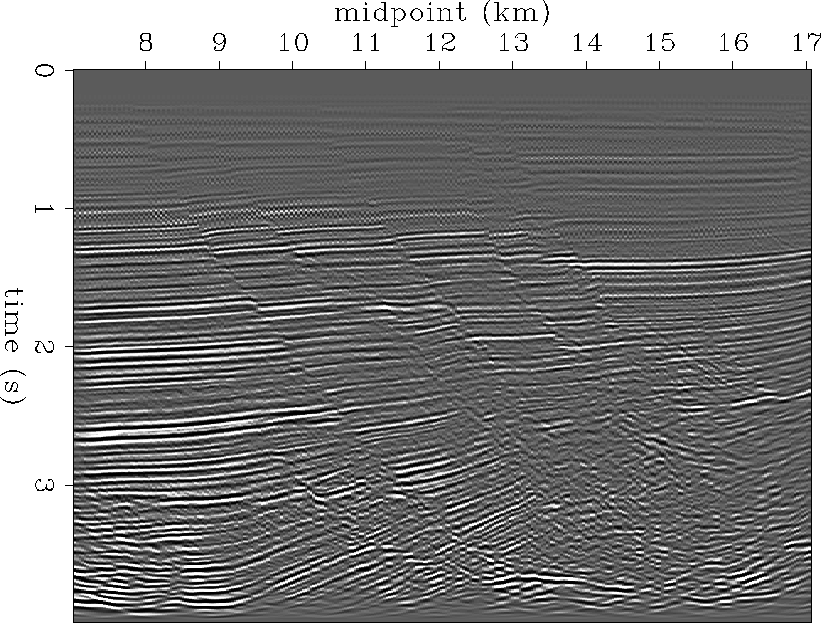
Figure ![[*]](http://sepwww.stanford.edu/latex2html/cross_ref_motif.gif) shows a Kirchhoff prestack time migration with
the 1-D velocity field described before. Although the previous 1-D stack
was not very coherent to the east, the prestack migration has done an
amazing job. This seems to indicate that time migration is less
sensitive to velocity error than NMO stacking. Figure
shows a Kirchhoff prestack time migration with
the 1-D velocity field described before. Although the previous 1-D stack
was not very coherent to the east, the prestack migration has done an
amazing job. This seems to indicate that time migration is less
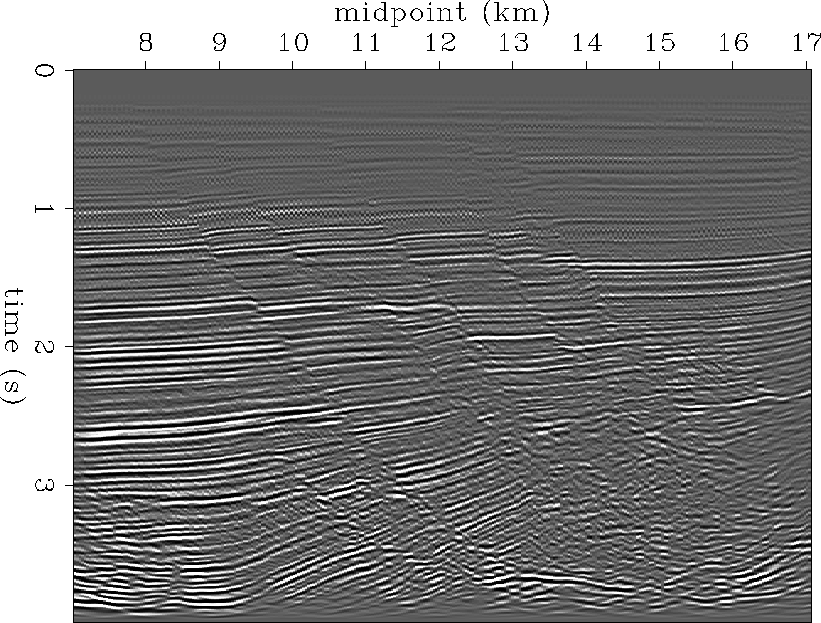
sensitive to velocity error than NMO stacking. Figure ![[*]](http://sepwww.stanford.edu/latex2html/cross_ref_motif.gif) is the Kirchhoff prestack time migration using the optimal 2-D
Monte Carlo velocity field of Figure
is the Kirchhoff prestack time migration using the optimal 2-D
Monte Carlo velocity field of Figure ![[*]](http://sepwww.stanford.edu/latex2html/cross_ref_motif.gif) b.
The faulted blocks are very well defined from the base right up to
the surface. Figure
b.
The faulted blocks are very well defined from the base right up to
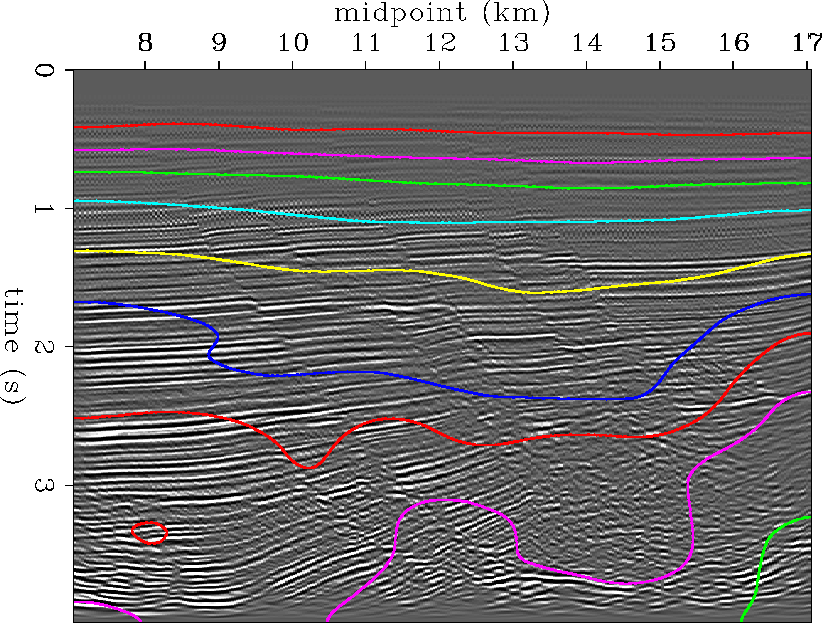
the surface. Figure ![[*]](http://sepwww.stanford.edu/latex2html/cross_ref_motif.gif) is an overlay of the smoothed
Monte Carlo interval velocity field on the prestack time migration
of Figure
is an overlay of the smoothed
Monte Carlo interval velocity field on the prestack time migration
of Figure ![[*]](http://sepwww.stanford.edu/latex2html/cross_ref_motif.gif) . Above 3 seconds there is a fairly good
low frequency correlation between migrated structure and interval velocity.
However, below 3 seconds the velocities are rather dubious in reliability.
There is definite bias due to structural dip, as seen at 12 km, 3.5 seconds,
and at the easternmost edge of the section, kilometer 17.
It would be interesting to compute migration velocity spectra for this data
set, and repeat the process of making the automatic Monte Carlo velocity
picks and remigrating the data.
. Above 3 seconds there is a fairly good
low frequency correlation between migrated structure and interval velocity.
However, below 3 seconds the velocities are rather dubious in reliability.
There is definite bias due to structural dip, as seen at 12 km, 3.5 seconds,
and at the easternmost edge of the section, kilometer 17.
It would be interesting to compute migration velocity spectra for this data
set, and repeat the process of making the automatic Monte Carlo velocity
picks and remigrating the data.
mig1
Figure 14 Kirchhoff prestack time migration using
a 1-D velocity corresponding to the single Monte Carlo fit at
midpoint 7 km.


 mcmig
mcmig
Figure 15 Kirchhoff prestack time migration using
the optimal 2-D Monte Carlo smoothed velocity field.


 mcvintmig
Figure 16 Overlay of the smoothed Monte Carlo
interval velocities upon best Kirchhoff prestack time migration.


Next: CONCLUSION
Up: A MARINE DATA EXAMPLE
Previous: Monte Carlo velocity picks
Stanford Exploration Project
11/17/1997
![[*]](http://sepwww.stanford.edu/latex2html/cross_ref_motif.gif) shows a Kirchhoff prestack time migration with
the 1-D velocity field described before. Although the previous 1-D stack
was not very coherent to the east, the prestack migration has done an
amazing job. This seems to indicate that time migration is less
sensitive to velocity error than NMO stacking. Figure
shows a Kirchhoff prestack time migration with
the 1-D velocity field described before. Although the previous 1-D stack
was not very coherent to the east, the prestack migration has done an
amazing job. This seems to indicate that time migration is less
sensitive to velocity error than NMO stacking. Figure ![[*]](http://sepwww.stanford.edu/latex2html/cross_ref_motif.gif) is the Kirchhoff prestack time migration using the optimal 2-D
Monte Carlo velocity field of Figure
is the Kirchhoff prestack time migration using the optimal 2-D
Monte Carlo velocity field of Figure ![[*]](http://sepwww.stanford.edu/latex2html/cross_ref_motif.gif) b.
The faulted blocks are very well defined from the base right up to
the surface. Figure
b.
The faulted blocks are very well defined from the base right up to
the surface. Figure ![[*]](http://sepwww.stanford.edu/latex2html/cross_ref_motif.gif) is an overlay of the smoothed
Monte Carlo interval velocity field on the prestack time migration
of Figure
is an overlay of the smoothed
Monte Carlo interval velocity field on the prestack time migration
of Figure ![[*]](http://sepwww.stanford.edu/latex2html/cross_ref_motif.gif) . Above 3 seconds there is a fairly good
low frequency correlation between migrated structure and interval velocity.
However, below 3 seconds the velocities are rather dubious in reliability.
There is definite bias due to structural dip, as seen at 12 km, 3.5 seconds,
and at the easternmost edge of the section, kilometer 17.
It would be interesting to compute migration velocity spectra for this data
set, and repeat the process of making the automatic Monte Carlo velocity
picks and remigrating the data.
. Above 3 seconds there is a fairly good
low frequency correlation between migrated structure and interval velocity.
However, below 3 seconds the velocities are rather dubious in reliability.
There is definite bias due to structural dip, as seen at 12 km, 3.5 seconds,
and at the easternmost edge of the section, kilometer 17.
It would be interesting to compute migration velocity spectra for this data
set, and repeat the process of making the automatic Monte Carlo velocity
picks and remigrating the data.


