![[*]](http://sepwww.stanford.edu/latex2html/cross_ref_motif.gif) to
to ![[*]](http://sepwww.stanford.edu/latex2html/cross_ref_motif.gif) .
.
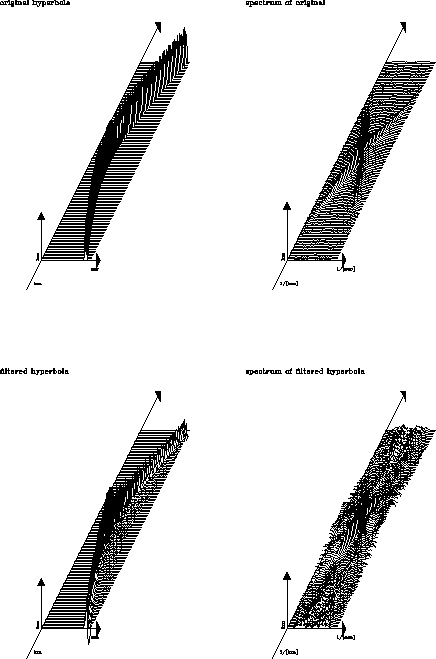
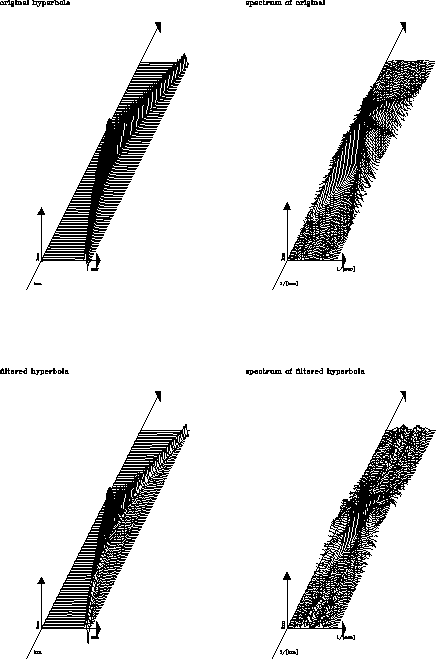
For comparison, we tried whitening three types of hyperbolas: a purely kinematic hyperbola, a hyperbola with some amplitude corrections, and a hyperbola with the amplitude corrections and a half-derivative filter. A hyperbola with only the kinematics was built by placing points on a grid along a hyperbolic path with a little interpolation. The next best approximation to a correct hyperbola was to add cosine and spherical divergence terms. Finally, a half-derivative filter was added to the amplitude corrected hyperbola. Hyperbola whitening was applied to these three cases with a 2-D prediction-error filter. If this version of hyperbola whitening works, we expect similar results from all three cases, and we expect the operator applied to the hyperbola with amplitude and half-derivative corrections to do almost nothing.
Each hyperbola was passed through the 2-D prediction-error filter, and
the input and the output spectrums were displayed.
The prediction-error filters were 3 elements in the trace direction and
25 elements in the time direction. The results are
shown in Figures ![[*]](http://sepwww.stanford.edu/latex2html/cross_ref_motif.gif) to
to ![[*]](http://sepwww.stanford.edu/latex2html/cross_ref_motif.gif) .
.
 |
Figure ![[*]](http://sepwww.stanford.edu/latex2html/cross_ref_motif.gif) shows some whitening of the spectrum of the
hyperbola without amplitude corrections, but the evanescent
zone shows some noise buildup. The spectrum shows a spike at the origin,
indicating that some undesired D.C. is being passed, but the results
are encouraging. The ridges in the spectrum may be
caused by a
filter that was too short in the time direction.
shows some whitening of the spectrum of the
hyperbola without amplitude corrections, but the evanescent
zone shows some noise buildup. The spectrum shows a spike at the origin,
indicating that some undesired D.C. is being passed, but the results
are encouraging. The ridges in the spectrum may be
caused by a
filter that was too short in the time direction.
 |
Figure ![[*]](http://sepwww.stanford.edu/latex2html/cross_ref_motif.gif) , with the amplitude corrected hyperbola, shows that
the amplitudes of
the limbs of the hyperbola are significantly lowered after the
prediction-error filter. This is likely to be the result of the
buildup of the operator in the evanescent zone.
While the spectrums in Figure
, with the amplitude corrected hyperbola, shows that
the amplitudes of
the limbs of the hyperbola are significantly lowered after the
prediction-error filter. This is likely to be the result of the
buildup of the operator in the evanescent zone.
While the spectrums in Figure ![[*]](http://sepwww.stanford.edu/latex2html/cross_ref_motif.gif) and
Figure
and
Figure ![[*]](http://sepwww.stanford.edu/latex2html/cross_ref_motif.gif) appear similar, and the amplitudes of the filtered
hyperbolas are close, there are some differences, especially on the
limbs.
appear similar, and the amplitudes of the filtered
hyperbolas are close, there are some differences, especially on the
limbs.
 |
The spectrum of the hyperbola with amplitude and half-derivative corrections
has noise inside the evanescent zone after the application of the
prediction-error filter, as seen in Figure ![[*]](http://sepwww.stanford.edu/latex2html/cross_ref_motif.gif) .
It is disappointing to see the spectrum is less flat after
filtering than before.
The prediction-error filter has done significant damage to
this hyperbola, where little change was expected.
Once again, the damage may be attributed to the buildup of the
zone.
It is interesting to
note that the filtered hyperbolas and their spectrums look
similar in each of the figures.
.
It is disappointing to see the spectrum is less flat after
filtering than before.
The prediction-error filter has done significant damage to
this hyperbola, where little change was expected.
Once again, the damage may be attributed to the buildup of the
zone.
It is interesting to
note that the filtered hyperbolas and their spectrums look
similar in each of the figures.