


We saw already that most of the Txx.H data consists of
zero values that are not very interesting for us.
Let's trim the data a bit.
The SEPlib utility Window is used for this purpose.
If you remember, Txx.H consists
of 1 plane of 20 traces, with 1024 samples in each trace.![[*]](http://sepwww.stanford.edu/latex2html/foot_motif.gif) In SEPlib notation,
In SEPlib notation, n3=1 n2=20 n1=1024.
Let's ``zoom in'' on the interesting part of the data between
times .4 and .8 seconds and offsets from the smallest (.1)
up to 1.
(i.e., we will keep samples 200 through 400 of the first 10 traces).
To do its job Window
needs to know the number of samples and the first sample
to accept for each axis. (The defaults are ``all of them that you can''
and ``begin at the beginning'', respectively.)
For our example we would have:
Window < Txx.H n2=10 n1=200 f1=200 > Txx_Windowed.HFortunately
Window is smart enough to understand your command
using the values on the two axes too:
Window < Txx.H min1=.4 max1=.8 max2=1. > Txx_Windowed.H
We must warn you that the second method is more risky,
since it is possible that you have an error
in the sampling parameters such as
o1 and d1 in the history file, or you simply forgot
to specify them at all (so they defaulted to 0 and 1
respectively).
You may prefer to tell Window where to start and end
using integer sample numbers.
If you are sure that you would never make such mistakes, did you catch the
discrepancy in the two examples above?
You'll find they don't give quite the same results!
Starting at .4 and ending at .8 is 201 samples, not 200.
As usual for computer programs, Window does what you tell it to
do, not necessarily what you mean for it to do.
Whichever way you did it,
In Txx_Windowed.Hshows us the file
Txx_Windowed.H is much reduced in size:
Txx_Windowed.H:
in="/usr/local/sep/scr/joe/_Txx_Windowed.H@"
        expands to in="/usr/local/sep/scr/joe/_Txx_Windowed.H@"
        esize=4
        n1=200  n2=10   n3=1    n4=1            2010 elem       8040 bytes
        d1=.002 d2=.1   d3=1    d4=1
        o1=.4   o2=.1   o3=0    o4=0
        label1=Time, seconds
        label2=Offset, kilometers
Note in particular the new value for o1.
Now let's have a look at what we have done:
Wiggle < Txx_Windowed.H | Tube
So far so good, but let's suppose that the journal you are submitting to
insists wiggle plots must have
traces that run down instead of across,
the order of the traces must go the other way,
and the traces must have geophysical-style shading.
No problem; from Wiggle's self documentation
you find there are three parameters that are likely to do what you need.
Try them out:
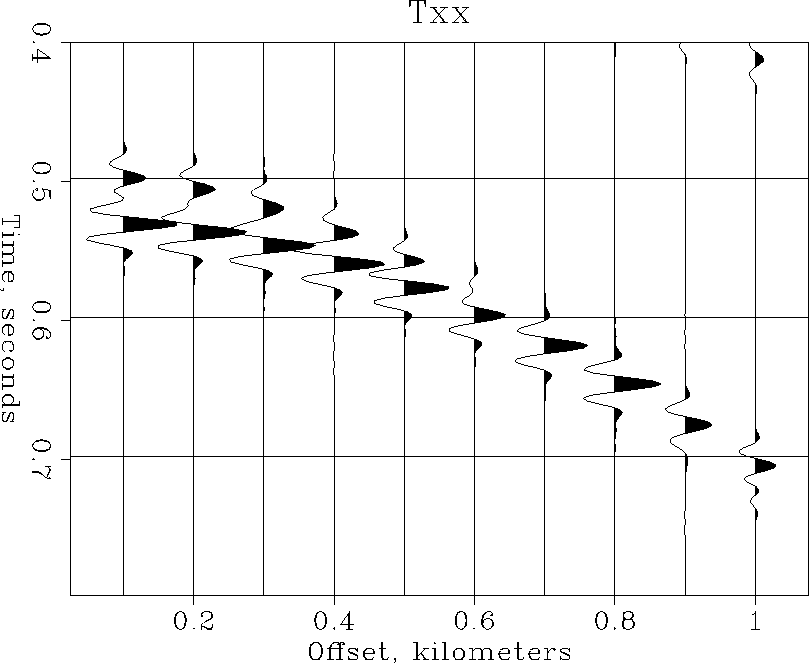
Wiggle < Txx_Windowed.H transp=yes poly=yes yreverse=yes | TubePerhaps it would be better if the trace amplitudes were a little lower? The parameter
pclip stands for ``percentile clip''; the default
is Wiggle < Txx_Windowed.H transp=y poly=y yreverse=y pclip=100 | Tube(Figure
![[*]](http://sepwww.stanford.edu/latex2html/cross_ref_motif.gif) shows what this plot should look like.)
shows what this plot should look like.)
 |
Wiggle < Txx\_Windowed.H par=plotpar | Pspen


Note most SEPlib programs don't care whether you type
``yes'' or ``no'', ``y'' or ``n'', or
even ``1'' or ``0''. (Although a few old FORTRAN ones
only accept the numbers, and a few old C ones only accept the letters.)
Looking at Wiggle's self-doc you may have noticed that
Wiggle also supports parameters like ``min1'' and ``max2''.
These will usually work just like the ones in Window and
probably seem like the preferred way to do windowing of plots.
Unfortunately (for now at least) Wiggle does the windowing a lazy way.
The whole plot is calculated (and plotted!) just as before,
and the graphics driver does all the work of trimming away the excess.
You can use these parameters of plot programs like Wiggle to make
slight adjustments to the boundaries of a plot, or to make a plot smaller,
but don't use them to ``zoom in'' very far! (We'll see an example of
a legitimate use of these ``dangerous'' parameters in a few pages.)