

Next: Migration velocity analysis
Up: MARINE DATA EXAMPLE
Previous: MARINE DATA EXAMPLE
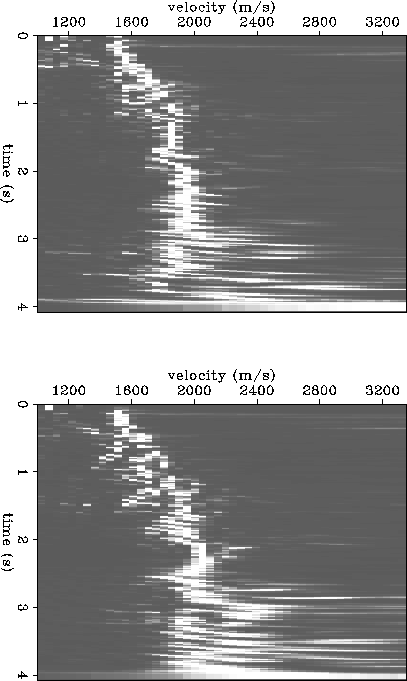
Figure ![[*]](http://sepwww.stanford.edu/latex2html/cross_ref_motif.gif) shows two stacking velocity semblance panels. The top
panel corresponds to the CMP location at x = 4 km, and the bottom
panel to x = 4.7 km. Figure
shows two stacking velocity semblance panels. The top
panel corresponds to the CMP location at x = 4 km, and the bottom
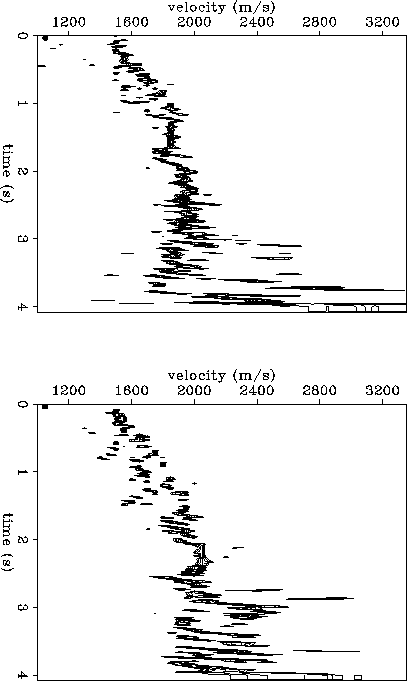
panel to x = 4.7 km. Figure ![[*]](http://sepwww.stanford.edu/latex2html/cross_ref_motif.gif) contains the same information,
but is plotted in contours as opposed to raster. I have spent some effort
trying to fine-tune the stacking velocity algorithm, to ``tighten''
the velocity spectrum, but perhaps some more work could be done
as indicated by the residual semblance smear.
contains the same information,
but is plotted in contours as opposed to raster. I have spent some effort
trying to fine-tune the stacking velocity algorithm, to ``tighten''
the velocity spectrum, but perhaps some more work could be done
as indicated by the residual semblance smear.
Currently, the main computational core of the CM code is running at
a modest 120 Mflop/s on 8k processors. This is because the
indirect memory addressing, shifting, and integer/boolean operations
cumulatively require a large percentage of the cpu time compared to the
low flop count. A stacking
velocity analysis of 32 48-fold CMP gathers, 2,000 samples per trace,
with 48 stacking velocities and 256 output time samples, requires
a total of about 75 cpu seconds on 4k processors.
About 30 s of that time is required
to read input data from an NFS mounted disk to the front-end memory,
another 10 s to transfer the data from the front-end to the CM, about
30 s to do the computations within the CM, and about 5 seconds to
write the results from the CM to front-end to disk. Evidently, this
process is heavily I/O bound, since I/O requires about 60% of the total
run time. With a 10 Mb/s data vault or disk array, the I/O bottleneck
could largely be eliminated (since the 32 gathers represent 12 Mb of data),
which would speed up the effective run time by a factor of about 2.5x.
vstackR
Figure 5 Stacking velocity panels, raster
display. The top panel corresponds to a CMP location at 4.0 km, and
the bottom panel corresponds to a CMP location at 4.7 km.
 vstackC
Figure 6 Stacking velocity panels, contour
display. The top panel corresponds to a CMP location at 4.0 km, and
the bottom panel corresponds to a CMP location at 4.7 km.


Next: Migration velocity analysis
Up: MARINE DATA EXAMPLE
Previous: MARINE DATA EXAMPLE
Stanford Exploration Project
11/18/1997
![[*]](http://sepwww.stanford.edu/latex2html/cross_ref_motif.gif) shows two stacking velocity semblance panels. The top
panel corresponds to the CMP location at x = 4 km, and the bottom
panel to x = 4.7 km. Figure
shows two stacking velocity semblance panels. The top
panel corresponds to the CMP location at x = 4 km, and the bottom
panel to x = 4.7 km. Figure ![[*]](http://sepwww.stanford.edu/latex2html/cross_ref_motif.gif) contains the same information,
but is plotted in contours as opposed to raster. I have spent some effort
trying to fine-tune the stacking velocity algorithm, to ``tighten''
the velocity spectrum, but perhaps some more work could be done
as indicated by the residual semblance smear.
contains the same information,
but is plotted in contours as opposed to raster. I have spent some effort
trying to fine-tune the stacking velocity algorithm, to ``tighten''
the velocity spectrum, but perhaps some more work could be done
as indicated by the residual semblance smear.

