


Next: SUMMARY
Up: Cunha: Vector wavefield from
Previous: The vectorizer operator
To test the resolution of the method I generated a synthetic dataset
using the elastic finite differences algorithm described in
Cunha (1992). Both the displacement and pressure wavefields
were ``recorded" at the gridpoints associated with the recording cable.
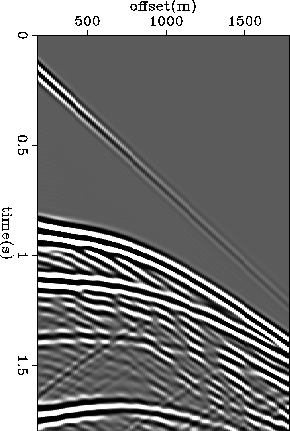
Figure ![[*]](http://sepwww.stanford.edu/latex2html/cross_ref_motif.gif) shows the recorded pressure field corresponding
to a shot gather. The model is structurally complex and the effect
of dipping beds is clear from the figure, as well as the presence of
diffractions and converted modes.
shows the recorded pressure field corresponding
to a shot gather. The model is structurally complex and the effect
of dipping beds is clear from the figure, as well as the presence of
diffractions and converted modes.
pressure
Figure 2 Pressure field at depth 12.5 meters, corresponding to a common shot
gather generated by an elastic modeling algorithm.

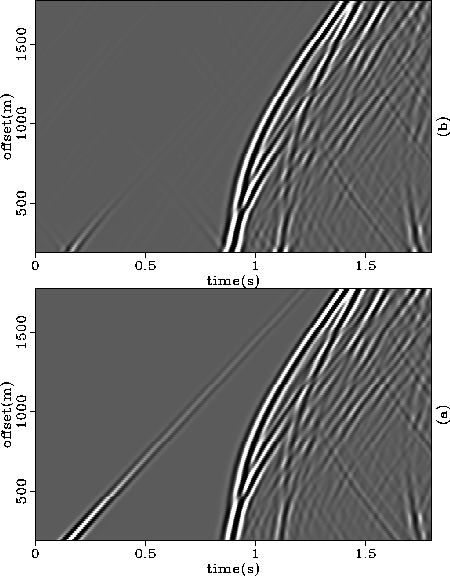
Figure ![[*]](http://sepwww.stanford.edu/latex2html/cross_ref_motif.gif) compares the true (computed by the modeling
algorithm) horizontal component of the displacement field with the
horizontal component retrieved from the pressure field using
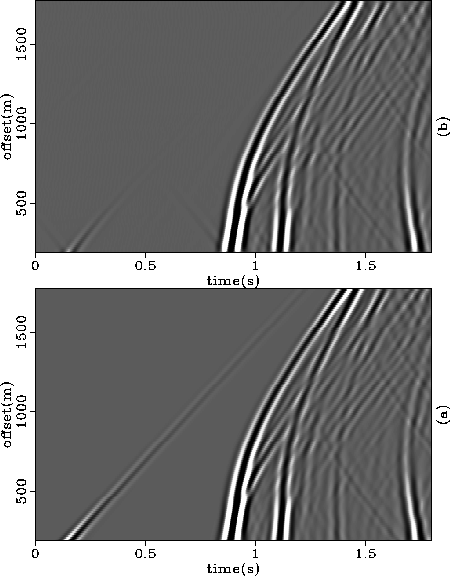
the vectorizer operator. The same comparison for the vertical
component is shown in Figure
compares the true (computed by the modeling
algorithm) horizontal component of the displacement field with the
horizontal component retrieved from the pressure field using
the vectorizer operator. The same comparison for the vertical
component is shown in Figure ![[*]](http://sepwww.stanford.edu/latex2html/cross_ref_motif.gif) . The result from subtracting the
true from the retrieved fields is shown in Figure
. The result from subtracting the
true from the retrieved fields is shown in Figure ![[*]](http://sepwww.stanford.edu/latex2html/cross_ref_motif.gif) .
The differences are larger at the near and far offsets because of the missing
information associated with the finite aperture of the data. The missing
information affects not only the estimation of the pressure gradient
in the decomposition scheme, but also the estimation of the divergence
of the displacement field that the modeling algorithm uses to generate
the pressure data. The direct wave, as well as other events with similar
step-out, are also not correctly retrieved because of the taper that needs
to be applied near the boundary with the evanescent region
(
.
The differences are larger at the near and far offsets because of the missing
information associated with the finite aperture of the data. The missing
information affects not only the estimation of the pressure gradient
in the decomposition scheme, but also the estimation of the divergence
of the displacement field that the modeling algorithm uses to generate
the pressure data. The direct wave, as well as other events with similar
step-out, are also not correctly retrieved because of the taper that needs
to be applied near the boundary with the evanescent region
( ). As one would expect, the
fit between the true and retrieved wavefields is better for
the horizontal component because it is much easier to compute
the spatial derivative along the direction in which the data is collected
than orthogonally to that direction.
It is evident that the frequency content of the retrieved vertical
component is lower than that of its true counterpart. This ``side-effect"
should also be expected, because the vertical component of the
vectorizer operator clearly favors the low-frequency part of the spectrum.
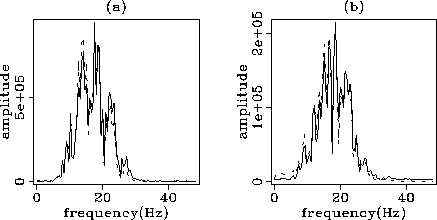
Figure ![[*]](http://sepwww.stanford.edu/latex2html/cross_ref_motif.gif) shows the time-spectra of a near and far offset
of the retrieved and true vertical components. This figure shows
that the frequencies where the zeros of the spectrum are
located were correctly estimated, but their amplitudes (i.e., how
far they are from the unit circle) are slightly different from the correct
ones.
shows the time-spectra of a near and far offset
of the retrieved and true vertical components. This figure shows
that the frequencies where the zeros of the spectrum are
located were correctly estimated, but their amplitudes (i.e., how
far they are from the unit circle) are slightly different from the correct
ones.
xcomp
Figure 3 (a) Horizontal component of the displacement field generated
by an elastic modeling algorithm. The pressure field in Figure
![[*]](http://sepwww.stanford.edu/latex2html/cross_ref_motif.gif) was obtained from this component and the vertical
component shown in Figure
was obtained from this component and the vertical
component shown in Figure ![[*]](http://sepwww.stanford.edu/latex2html/cross_ref_motif.gif) -a by a divergence
operation. (b) Horizontal component retrieved from the pressure
field using the vectorizer operator.
-a by a divergence
operation. (b) Horizontal component retrieved from the pressure
field using the vectorizer operator.
 zcomp
zcomp
Figure 4 (a) Vertical component of the displacement field generated
by an elastic modeling algorithm. (b) Vertical component retrieved
from the pressure field using the vectorizer operator.
 vecdiff
Figure 5 (a) Difference between the true and retrieved horizontal components
shown in Figure ![[*]](http://sepwww.stanford.edu/latex2html/cross_ref_motif.gif) . (b) Difference between the true and
retrieved vertical components shown in Figure
. (b) Difference between the true and
retrieved vertical components shown in Figure ![[*]](http://sepwww.stanford.edu/latex2html/cross_ref_motif.gif) .
.
 zspecs
Figure 6 Comparison between the time-spectra of the true and retrieved
vertical components shown in Figure ![[*]](http://sepwww.stanford.edu/latex2html/cross_ref_motif.gif) for (a) the fifth
offset and (b) the 80th offset.
for (a) the fifth
offset and (b) the 80th offset.

The method was also tested on an offshore dataset from Brazil, which was
recorded in an area with an irregular ocean floor, and
with slightly structured subsurface geology. According to the observer's
report, the cable depth ranged from 9 to 11 meters, with some
additional oscillations of about 1.5 meters in the sea level.
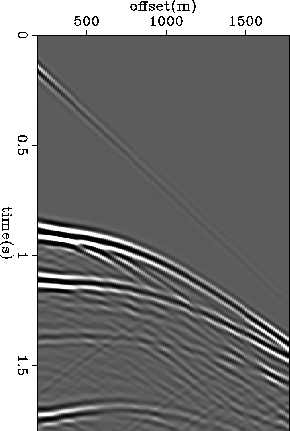
Figure ![[*]](http://sepwww.stanford.edu/latex2html/cross_ref_motif.gif) shows the common shot gather used in
the tests.
shows the common shot gather used in
the tests.
E213press
Figure 7 Common shot point gather from Brazil. The average depth of the cable
is 10 meters.

Figure ![[*]](http://sepwww.stanford.edu/latex2html/cross_ref_motif.gif) shows the resulting vector field obtained with the
method described. As with the synthetics, the dominant frequency is lower
in the vertical component than in the horizontal component. Although a
direct comparison with the true vector field is not possible here, there
are some tests that can show at least the self-consistency of the result.
One test involves the sensitivity of the method to errors in the correct
depth of the cable.
shows the resulting vector field obtained with the
method described. As with the synthetics, the dominant frequency is lower
in the vertical component than in the horizontal component. Although a
direct comparison with the true vector field is not possible here, there
are some tests that can show at least the self-consistency of the result.
One test involves the sensitivity of the method to errors in the correct
depth of the cable.
E213vec
Figure 8 (a) Horizontal and (b) vertical components of the displacement field
retrieved from the pressure field shown in Figure ![[*]](http://sepwww.stanford.edu/latex2html/cross_ref_motif.gif) .
.

In the space-time domain each point of the cable will ``see" at the
same time an upcoming wavefield arriving at an angle  and
a downgoing wavefield arriving at an angle
  . If the
subsurface has some degree of lateral smoothing, then
  and the amplitude of the downgoing wave will be a delayed
version of the amplitude of the incident wave with reversed polarity.
The resulting superposition will have an apparent arrival angle
(as measured by the displacement field direction) that covers
the full range from
  to
to  . In addition total
wavefield will have maximum amplitude at the apparent angle
  .
.
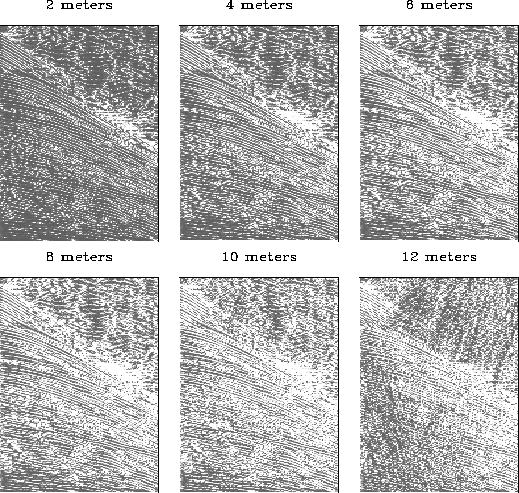
Figure ![[*]](http://sepwww.stanford.edu/latex2html/cross_ref_motif.gif) shows the absolute apparent angle panels generated from
the elastic wavefields estimated from the data in Figure
shows the absolute apparent angle panels generated from
the elastic wavefields estimated from the data in Figure ![[*]](http://sepwww.stanford.edu/latex2html/cross_ref_motif.gif) using six different values of cable depth. The first two panels are
predominantly dark with a few white sparks, which indicates very small
apparent angles, that is, almost vertical arrivals. The last panel
starts to lose lateral coherence, which indicates random
apparent angles. The two panels corresponding to cable depths of
8 and 10 meters give the more coherent images, which is consistent with
the in-site measured values.
using six different values of cable depth. The first two panels are
predominantly dark with a few white sparks, which indicates very small
apparent angles, that is, almost vertical arrivals. The last panel
starts to lose lateral coherence, which indicates random
apparent angles. The two panels corresponding to cable depths of
8 and 10 meters give the more coherent images, which is consistent with
the in-site measured values.
E213zanal
Figure 9 Apparent-angle coherence analysis of the data shown in
Figure ![[*]](http://sepwww.stanford.edu/latex2html/cross_ref_motif.gif) . Each panel corresponds to an arriving angle
panel for the elastic wavefield obtained with different values of cable depth.
. Each panel corresponds to an arriving angle
panel for the elastic wavefield obtained with different values of cable depth.


Next: SUMMARY
Up: Cunha: Vector wavefield from
Previous: The vectorizer operator
Stanford Exploration Project
11/18/1997
![[*]](http://sepwww.stanford.edu/latex2html/cross_ref_motif.gif) shows the recorded pressure field corresponding
to a shot gather. The model is structurally complex and the effect
of dipping beds is clear from the figure, as well as the presence of
diffractions and converted modes.
shows the recorded pressure field corresponding
to a shot gather. The model is structurally complex and the effect
of dipping beds is clear from the figure, as well as the presence of
diffractions and converted modes.
![[*]](http://sepwww.stanford.edu/latex2html/cross_ref_motif.gif) compares the true (computed by the modeling
algorithm) horizontal component of the displacement field with the
horizontal component retrieved from the pressure field using
the vectorizer operator. The same comparison for the vertical
component is shown in Figure
compares the true (computed by the modeling
algorithm) horizontal component of the displacement field with the
horizontal component retrieved from the pressure field using
the vectorizer operator. The same comparison for the vertical
component is shown in Figure ![[*]](http://sepwww.stanford.edu/latex2html/cross_ref_motif.gif) . The result from subtracting the
true from the retrieved fields is shown in Figure
. The result from subtracting the
true from the retrieved fields is shown in Figure ![[*]](http://sepwww.stanford.edu/latex2html/cross_ref_motif.gif) .
The differences are larger at the near and far offsets because of the missing
information associated with the finite aperture of the data. The missing
information affects not only the estimation of the pressure gradient
in the decomposition scheme, but also the estimation of the divergence
of the displacement field that the modeling algorithm uses to generate
the pressure data. The direct wave, as well as other events with similar
step-out, are also not correctly retrieved because of the taper that needs
to be applied near the boundary with the evanescent region
(
.
The differences are larger at the near and far offsets because of the missing
information associated with the finite aperture of the data. The missing
information affects not only the estimation of the pressure gradient
in the decomposition scheme, but also the estimation of the divergence
of the displacement field that the modeling algorithm uses to generate
the pressure data. The direct wave, as well as other events with similar
step-out, are also not correctly retrieved because of the taper that needs
to be applied near the boundary with the evanescent region
(![]() ). As one would expect, the
fit between the true and retrieved wavefields is better for
the horizontal component because it is much easier to compute
the spatial derivative along the direction in which the data is collected
than orthogonally to that direction.
). As one would expect, the
fit between the true and retrieved wavefields is better for
the horizontal component because it is much easier to compute
the spatial derivative along the direction in which the data is collected
than orthogonally to that direction.
![[*]](http://sepwww.stanford.edu/latex2html/cross_ref_motif.gif) shows the time-spectra of a near and far offset
of the retrieved and true vertical components. This figure shows
that the frequencies where the zeros of the spectrum are
located were correctly estimated, but their amplitudes (i.e., how
far they are from the unit circle) are slightly different from the correct
ones.
shows the time-spectra of a near and far offset
of the retrieved and true vertical components. This figure shows
that the frequencies where the zeros of the spectrum are
located were correctly estimated, but their amplitudes (i.e., how
far they are from the unit circle) are slightly different from the correct
ones.
![[*]](http://sepwww.stanford.edu/latex2html/cross_ref_motif.gif) was obtained from this component and the vertical
component shown in Figure
was obtained from this component and the vertical
component shown in Figure ![[*]](http://sepwww.stanford.edu/latex2html/cross_ref_motif.gif) -a by a divergence
operation. (b) Horizontal component retrieved from the pressure
field using the vectorizer operator.
-a by a divergence
operation. (b) Horizontal component retrieved from the pressure
field using the vectorizer operator.
![[*]](http://sepwww.stanford.edu/latex2html/cross_ref_motif.gif) . (b) Difference between the true and
retrieved vertical components shown in Figure
. (b) Difference between the true and
retrieved vertical components shown in Figure ![[*]](http://sepwww.stanford.edu/latex2html/cross_ref_motif.gif) .
.
![[*]](http://sepwww.stanford.edu/latex2html/cross_ref_motif.gif) for (a) the fifth
offset and (b) the 80th offset.
for (a) the fifth
offset and (b) the 80th offset.
![[*]](http://sepwww.stanford.edu/latex2html/cross_ref_motif.gif) shows the common shot gather used in
the tests.
shows the common shot gather used in
the tests.

![[*]](http://sepwww.stanford.edu/latex2html/cross_ref_motif.gif) shows the resulting vector field obtained with the
method described. As with the synthetics, the dominant frequency is lower
in the vertical component than in the horizontal component. Although a
direct comparison with the true vector field is not possible here, there
are some tests that can show at least the self-consistency of the result.
One test involves the sensitivity of the method to errors in the correct
depth of the cable.
shows the resulting vector field obtained with the
method described. As with the synthetics, the dominant frequency is lower
in the vertical component than in the horizontal component. Although a
direct comparison with the true vector field is not possible here, there
are some tests that can show at least the self-consistency of the result.
One test involves the sensitivity of the method to errors in the correct
depth of the cable.

![[*]](http://sepwww.stanford.edu/latex2html/cross_ref_motif.gif) .
.
![]() and
a downgoing wavefield arriving at an angle
and
a downgoing wavefield arriving at an angle ![]() . If the
subsurface has some degree of lateral smoothing, then
. If the
subsurface has some degree of lateral smoothing, then ![]() and the amplitude of the downgoing wave will be a delayed
version of the amplitude of the incident wave with reversed polarity.
The resulting superposition will have an apparent arrival angle
(as measured by the displacement field direction) that covers
the full range from
and the amplitude of the downgoing wave will be a delayed
version of the amplitude of the incident wave with reversed polarity.
The resulting superposition will have an apparent arrival angle
(as measured by the displacement field direction) that covers
the full range from ![]() to
to ![]() . In addition total
wavefield will have maximum amplitude at the apparent angle
. In addition total
wavefield will have maximum amplitude at the apparent angle ![]() .
.![[*]](http://sepwww.stanford.edu/latex2html/cross_ref_motif.gif) shows the absolute apparent angle panels generated from
the elastic wavefields estimated from the data in Figure
shows the absolute apparent angle panels generated from
the elastic wavefields estimated from the data in Figure ![[*]](http://sepwww.stanford.edu/latex2html/cross_ref_motif.gif) using six different values of cable depth. The first two panels are
predominantly dark with a few white sparks, which indicates very small
apparent angles, that is, almost vertical arrivals. The last panel
starts to lose lateral coherence, which indicates random
apparent angles. The two panels corresponding to cable depths of
8 and 10 meters give the more coherent images, which is consistent with
the in-site measured values.
using six different values of cable depth. The first two panels are
predominantly dark with a few white sparks, which indicates very small
apparent angles, that is, almost vertical arrivals. The last panel
starts to lose lateral coherence, which indicates random
apparent angles. The two panels corresponding to cable depths of
8 and 10 meters give the more coherent images, which is consistent with
the in-site measured values.
![[*]](http://sepwww.stanford.edu/latex2html/cross_ref_motif.gif) . Each panel corresponds to an arriving angle
panel for the elastic wavefield obtained with different values of cable depth.
. Each panel corresponds to an arriving angle
panel for the elastic wavefield obtained with different values of cable depth.