

Next: VELOCITY ANALYSIS
Up: Cole: A drill-bit source
Previous: Introduction
To search for sources (such as the drill bit) in 3-D, I
first construct a cube of possible source locations. Then,
given an estimate of the velocity structure,
I compute
the moveout trajectory for energy arriving at the
array from each possible source. I compute semblance
over this moveout trajectory and examine the resulting
3-D semblance cube.
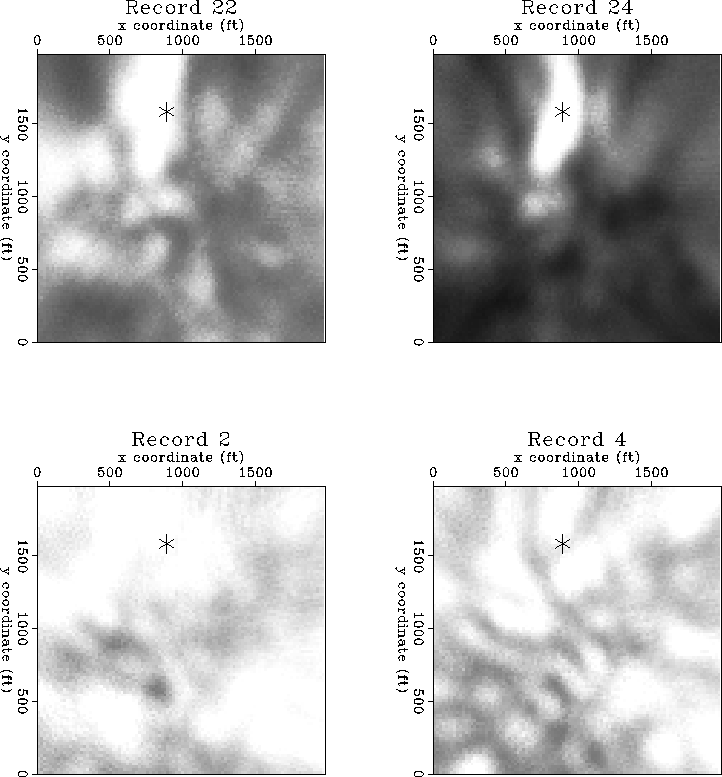
Figure ![[*]](http://sepwww.stanford.edu/latex2html/cross_ref_motif.gif) shows constant-depth slices
from such a cube, taken at the known depth of the
drill bit.
A constant velocity of 10000 ft/sec has been used
to compute moveout trajectories.
The four frames correspond to four different
data records; the two top records are from the ``quiet''
period where pumps within the array were turned off.
In the case of the bottom two records the pumps were operating.
The asterisk denotes the surface position of the drilling rig.
When the pumps are turned off, the largest semblance
values (shown in white) occur at the drill bit location. These semblance
values are likely due to direct arrivals from the drill bit.
shows constant-depth slices
from such a cube, taken at the known depth of the
drill bit.
A constant velocity of 10000 ft/sec has been used
to compute moveout trajectories.
The four frames correspond to four different
data records; the two top records are from the ``quiet''
period where pumps within the array were turned off.
In the case of the bottom two records the pumps were operating.
The asterisk denotes the surface position of the drilling rig.
When the pumps are turned off, the largest semblance
values (shown in white) occur at the drill bit location. These semblance
values are likely due to direct arrivals from the drill bit.
plotxy
Figure 2 plotxy

Stacking semblance as a function of x and y coordinates at the drill-bit
depth for four different data records. The largest semblance values are
shaded in white. For the top two records, taken while pumps
within the array were turned off, the largest semblance values
are at the drill bit location, suggesting that we are able
to see direct arrivals from the drill bit.
For the bottom two records, where the pumps were operating, the results
are much poorer. Note that the top and bottom plots are scaled
differently for comparison; the largest semblances in the top plots
are nearly three times those on the bottom.
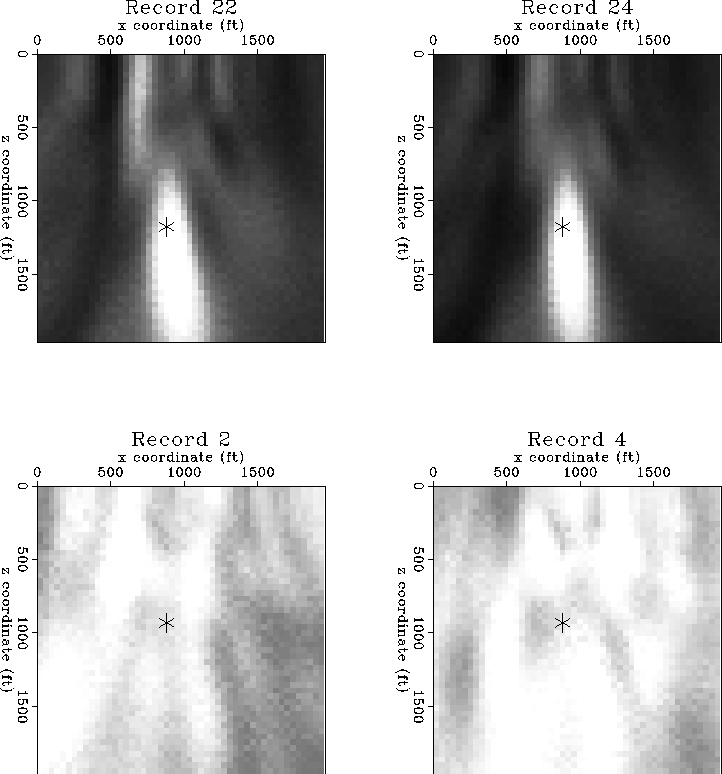
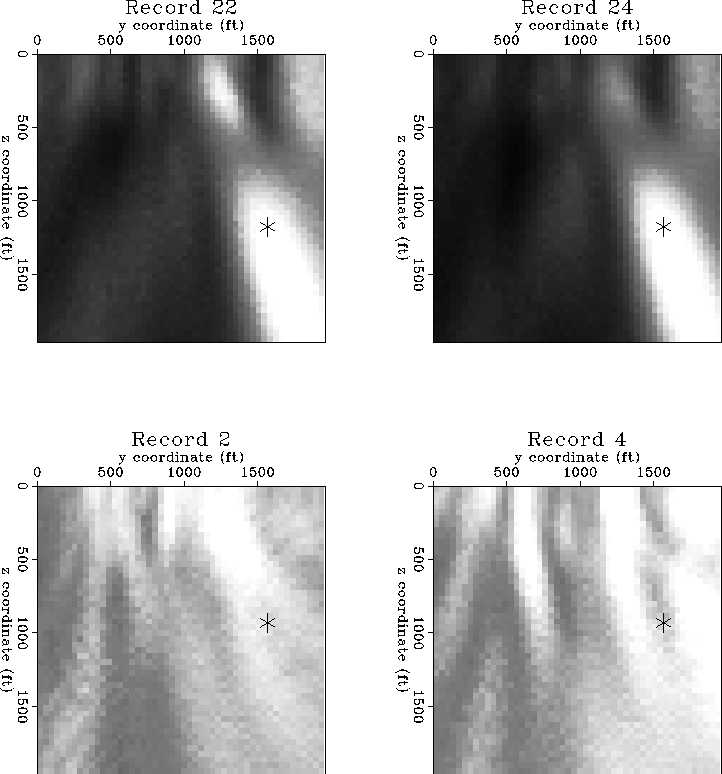
Figures ![[*]](http://sepwww.stanford.edu/latex2html/cross_ref_motif.gif) and
and ![[*]](http://sepwww.stanford.edu/latex2html/cross_ref_motif.gif) show constant y-coordinate
and constant x-coordinate slices through the same cube, for the
same four data records. The agreement with the drill bit location
in all three dimensions strengthens the claim that these large
semblance values are due to direct arrivals from the drill bit.
The resolution in space is not very good because only frequencies
up to 40 Hertz have been used. Higher frequencies degrade the
pictures - probably not because the drill bit signal does not
contain higher frequencies but rather because the moveout of
the signal departs from a constant-velocity hyperbola, and
the higher frequencies are more sensitive to mis-stacking.
show constant y-coordinate
and constant x-coordinate slices through the same cube, for the
same four data records. The agreement with the drill bit location
in all three dimensions strengthens the claim that these large
semblance values are due to direct arrivals from the drill bit.
The resolution in space is not very good because only frequencies
up to 40 Hertz have been used. Higher frequencies degrade the
pictures - probably not because the drill bit signal does not
contain higher frequencies but rather because the moveout of
the signal departs from a constant-velocity hyperbola, and
the higher frequencies are more sensitive to mis-stacking.
plotxz
Figure 3 plotxz

Stacking semblance as a function of x and z coordinates for a plane
passing through the drill bit location. The asterisk denotes
the location of the drill bit; note the change in depth between
the top and bottom pictures. The largest semblance values,
shaded in white,
coincide with the drill bit location for the two records from
the recording period where pumps within the array were turned off.
plotyz
Figure 4 plotyz

Stacking semblance as a function of y and z coordinates for a plane
passing through the drill bit location. The asterisk denotes
the location of the drill bit.
As in the previous two plots,
the largest semblance values correspond to the drill bit location,
further suggesting that the semblance values are due to direct
arrivals from the drill bit.


Next: VELOCITY ANALYSIS
Up: Cole: A drill-bit source
Previous: Introduction
Stanford Exploration Project
12/18/1997
![[*]](http://sepwww.stanford.edu/latex2html/cross_ref_motif.gif) shows constant-depth slices
from such a cube, taken at the known depth of the
drill bit.
A constant velocity of 10000 ft/sec has been used
to compute moveout trajectories.
The four frames correspond to four different
data records; the two top records are from the ``quiet''
period where pumps within the array were turned off.
In the case of the bottom two records the pumps were operating.
The asterisk denotes the surface position of the drilling rig.
When the pumps are turned off, the largest semblance
values (shown in white) occur at the drill bit location. These semblance
values are likely due to direct arrivals from the drill bit.
shows constant-depth slices
from such a cube, taken at the known depth of the
drill bit.
A constant velocity of 10000 ft/sec has been used
to compute moveout trajectories.
The four frames correspond to four different
data records; the two top records are from the ``quiet''
period where pumps within the array were turned off.
In the case of the bottom two records the pumps were operating.
The asterisk denotes the surface position of the drilling rig.
When the pumps are turned off, the largest semblance
values (shown in white) occur at the drill bit location. These semblance
values are likely due to direct arrivals from the drill bit.


