

Next: PRACTICAL ISSUES FOR THE
Up: Karrenbach: Prestack reverse-time migration
Previous: THE CONJUGATE
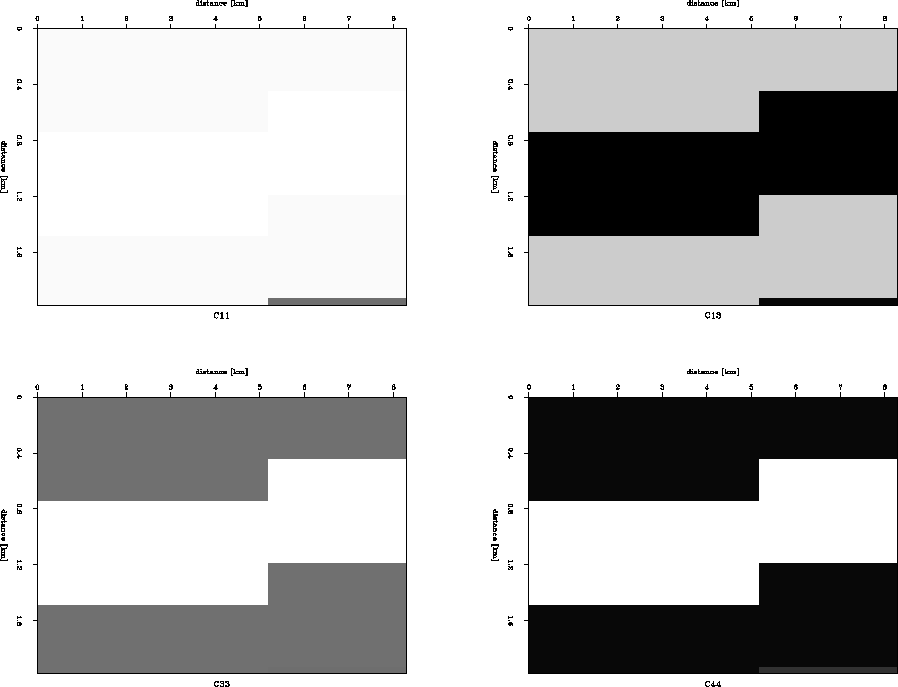
For testing the algorithm I used a 2D model consisting of horizontal
layers with a vertical discontinuity. Individual layers are made up of
isotropic and transverse isotropic materials. The top layer is isotropic,
the second one is transverse isotropic (TI),
followed by another isotropic/TI sequence.
All of them have constant density.
I chose horizontal layers to see if the reverse-time migration really
could recover relative amplitudes properly along the horizontal direction,
and to see how well an image of the fault could be obtained.
A surface spread of 8 km is covered by geophones with 40 m spacing.
I used only 16 sources in 400 m intervals at the surface.
Choosing a relatively small
number of source I wanted to push the method to its limits.
Figure ![[*]](http://sepwww.stanford.edu/latex2html/cross_ref_motif.gif) shows shot gathers for vertical
and
shows shot gathers for vertical
and ![[*]](http://sepwww.stanford.edu/latex2html/cross_ref_motif.gif) horizontal sources, situated at 4 locations along the profile. The triplicating
reflected event generated by the TI layer
is visible after about 1 s traveltime.
Reverse time migrating those 16 shot gathers, the subsurface image is
recovered as shown in Figure
horizontal sources, situated at 4 locations along the profile. The triplicating
reflected event generated by the TI layer
is visible after about 1 s traveltime.
Reverse time migrating those 16 shot gathers, the subsurface image is
recovered as shown in Figure ![[*]](http://sepwww.stanford.edu/latex2html/cross_ref_motif.gif) and
and ![[*]](http://sepwww.stanford.edu/latex2html/cross_ref_motif.gif) .
The result is a bandlimited image of the variations in subsurface stiffnesses.
The amplitudes correspond to changes in stiffnesses
(since I use the backpropagated data wavefield and not the residual wavefield).
In general it is the gradient of the material parameters, with which an update
of the input stiffness model is possible.
.
The result is a bandlimited image of the variations in subsurface stiffnesses.
The amplitudes correspond to changes in stiffnesses
(since I use the backpropagated data wavefield and not the residual wavefield).
In general it is the gradient of the material parameters, with which an update
of the input stiffness model is possible.
The plane reflectors and the step function are recovered well for C33
and C44
while C11 and C13 are recovered less well. Particularly the image of the sources
interferes with the image of the reflector and in the upper part of the
image. It is a consequence of not removing the first arrival in the
shot gathers
before migrating. The direct wave energy is then placed at the source position.
A combination of dip filter and polarization filter could be used to get
efficiently attenuate such energy.
In these examples the influence of that energy
and the influence of the source radiation pattern
is clearly visible in amplitude variations on top of the first reflector.
By using only 16 sources the subsurface is not illuminated uniformly and the
radiation pattern of the vertical source radiates P energy mainly in the
vertical direction, while S energy is radiated off to the sides (non-free
surface condition).
For the second reflector the direct wave energy does not
interfere much anymore and the curvature of the incident wavefield is rather
small, thus a more uniform image is obtained.
step
Figure 1 A 2D subsurface model with variable elastic stiffnesses and constant density.


Next: PRACTICAL ISSUES FOR THE
Up: Karrenbach: Prestack reverse-time migration
Previous: THE CONJUGATE
Stanford Exploration Project
12/18/1997
![[*]](http://sepwww.stanford.edu/latex2html/cross_ref_motif.gif) shows shot gathers for vertical
and
shows shot gathers for vertical
and ![[*]](http://sepwww.stanford.edu/latex2html/cross_ref_motif.gif) horizontal sources, situated at 4 locations along the profile. The triplicating
reflected event generated by the TI layer
is visible after about 1 s traveltime.
Reverse time migrating those 16 shot gathers, the subsurface image is
recovered as shown in Figure
horizontal sources, situated at 4 locations along the profile. The triplicating
reflected event generated by the TI layer
is visible after about 1 s traveltime.
Reverse time migrating those 16 shot gathers, the subsurface image is
recovered as shown in Figure ![[*]](http://sepwww.stanford.edu/latex2html/cross_ref_motif.gif) and
and ![[*]](http://sepwww.stanford.edu/latex2html/cross_ref_motif.gif) .
The result is a bandlimited image of the variations in subsurface stiffnesses.
The amplitudes correspond to changes in stiffnesses
(since I use the backpropagated data wavefield and not the residual wavefield).
In general it is the gradient of the material parameters, with which an update
of the input stiffness model is possible.
.
The result is a bandlimited image of the variations in subsurface stiffnesses.
The amplitudes correspond to changes in stiffnesses
(since I use the backpropagated data wavefield and not the residual wavefield).
In general it is the gradient of the material parameters, with which an update
of the input stiffness model is possible.
