

Next: CONCLUSIONS
Up: A REAL DATA EXAMPLE
Previous: Processing sequence
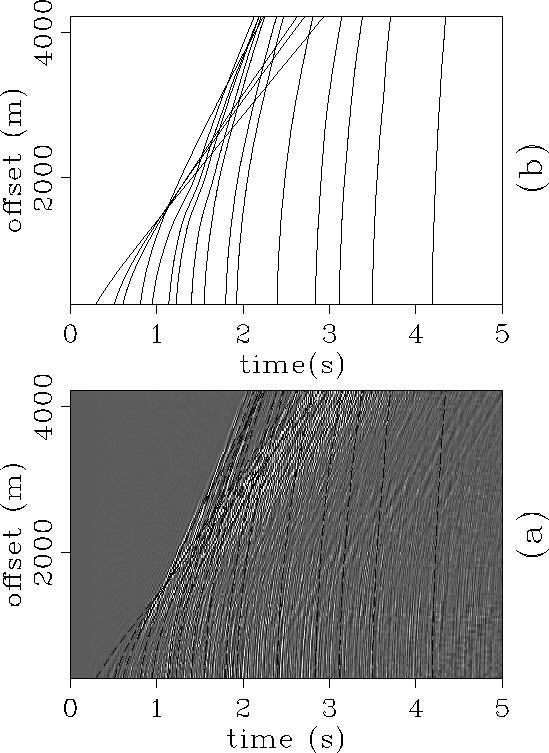
Figure ![[*]](http://sepwww.stanford.edu/latex2html/cross_ref_motif.gif) a shows the picked reflection-events overlaid
with the data shown in Figure
a shows the picked reflection-events overlaid
with the data shown in Figure ![[*]](http://sepwww.stanford.edu/latex2html/cross_ref_motif.gif) a.
For clarity, the same estimated events are
plotted without the data in Figure
a.
For clarity, the same estimated events are
plotted without the data in Figure ![[*]](http://sepwww.stanford.edu/latex2html/cross_ref_motif.gif) b. The detection of
these events (which cross the trend of multiples and linear noise)
was feasible because of the filters that were applied in the
b. The detection of
these events (which cross the trend of multiples and linear noise)
was feasible because of the filters that were applied in the  and
beam-stack domains.
A sonic log from a well drilled 1 Km away from the location of
the CMP gather was used to generate an interval velocity profile.
This well-velocity profile was smoothed with a high-cut Walsh-spectrum
filtering, to emphasize its "blockiness" and allow a better comparison
with the result of the inversion. The basic lithology includes
calcilutite in the top 1.5 kilometers, followed by shale in the next half
kilometer, then shale-sand from 2 to 3.5 Km, shale again to a depth
of 4.65 Km, and finally a calcarenite-calcilutite sequence. The low
velocity interval around 1.5 Km corresponds to a highly porous
sand-calcilutite transitional formation with occurrences of
shale and salt lenses.
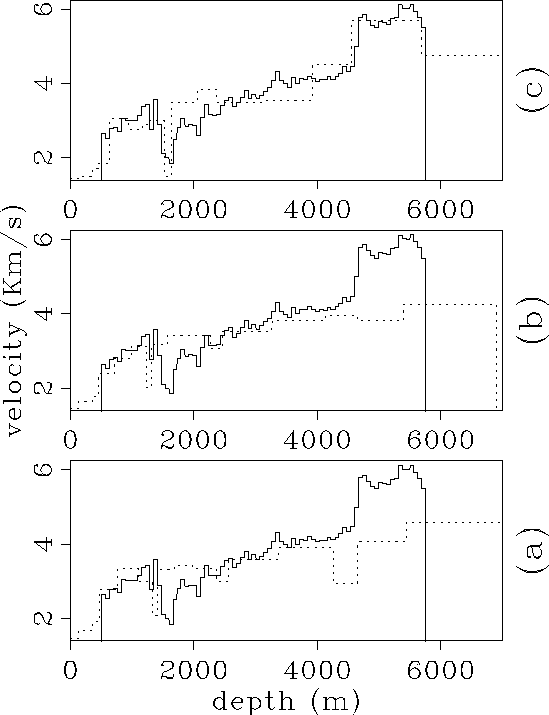
Figure ![[*]](http://sepwww.stanford.edu/latex2html/cross_ref_motif.gif) compares the
well-velocity profile with the velocity profile estimated from a Dix's
least-squares fitting of the picked events (
compares the
well-velocity profile with the velocity profile estimated from a Dix's
least-squares fitting of the picked events (![[*]](http://sepwww.stanford.edu/latex2html/cross_ref_motif.gif) a),
the result from the picking-based algorithm (
a),
the result from the picking-based algorithm (![[*]](http://sepwww.stanford.edu/latex2html/cross_ref_motif.gif) b), and
the result from hybrid method (
b), and
the result from hybrid method (![[*]](http://sepwww.stanford.edu/latex2html/cross_ref_motif.gif) c).
The results from the three inversions are reasonably similar
for the shallow layers, but the Dix-based as well as the
picked-based inversions completely fail at the deeper layers, while
the hybrid scheme maintains the same resolution at all depths.
Surprisingly, the deep, high-velocity,
carbonate sequence was almost perfectly resolved by the hybrid method.
Although [for the real data case] the errors are large in comparison
to the synthetic case, they are smaller than we should expect given
the low signal-to-noise ratio of the real data.
c).
The results from the three inversions are reasonably similar
for the shallow layers, but the Dix-based as well as the
picked-based inversions completely fail at the deeper layers, while
the hybrid scheme maintains the same resolution at all depths.
Surprisingly, the deep, high-velocity,
carbonate sequence was almost perfectly resolved by the hybrid method.
Although [for the real data case] the errors are large in comparison
to the synthetic case, they are smaller than we should expect given
the low signal-to-noise ratio of the real data.
events
Figure 12 (a) Final estimation of the reflected wavefronts overlaid
with the data shown in Figure ![[*]](http://sepwww.stanford.edu/latex2html/cross_ref_motif.gif) a. (b) The
same wavefronts of a.
a. (b) The
same wavefronts of a.
 vels
vels
Figure 13 The continuous lines are the sonic-derived velocity from a well
located 1 Km away from the CMP position. The dotted lines are the
results of (a) the least-squares Dix-hyperbola fitting of the
picked events, (b) the picking-based algorithm,
and (c) the hybrid algorithm.


Next: CONCLUSIONS
Up: A REAL DATA EXAMPLE
Previous: Processing sequence
Stanford Exploration Project
12/18/1997
![[*]](http://sepwww.stanford.edu/latex2html/cross_ref_motif.gif) a shows the picked reflection-events overlaid
with the data shown in Figure
a shows the picked reflection-events overlaid
with the data shown in Figure ![[*]](http://sepwww.stanford.edu/latex2html/cross_ref_motif.gif) a.
For clarity, the same estimated events are
plotted without the data in Figure
a.
For clarity, the same estimated events are
plotted without the data in Figure ![[*]](http://sepwww.stanford.edu/latex2html/cross_ref_motif.gif) b. The detection of
these events (which cross the trend of multiples and linear noise)
was feasible because of the filters that were applied in the
b. The detection of
these events (which cross the trend of multiples and linear noise)
was feasible because of the filters that were applied in the 
