


A subgroup was organized at SEP to work with these data, and several processes were applied before picking the traveltimes that I used in the inversion. Cole and Karrenbach (1990) decomposed the data into the three fundamental wavefields P, SV and SH, using an estimation of the P-wave particle motion direction. They then used the decomposed data to estimate the P and SV wavelets. The SH component did not show a coherent arrival that could be objectively associated to an SH arrival. This result was expected, since the source was not designed to vibrate around the vertical axis, and was therefore not appropriate for the generation of SH waves. We had some hope however, that a weak SH wavefield could be generated in connection with the heterogeneities of the earth in the vicinity of the source. Vanian (1990) used the estimated wavelets to deconvolve the data and tried to detect, in the velocity space, a coherent signal that could be identified with the SH arrival. At present, we are still unable to identify a consistent arrival that can be objectively interpreted as an SH wave, assuming that such a wave-type was generated at all.
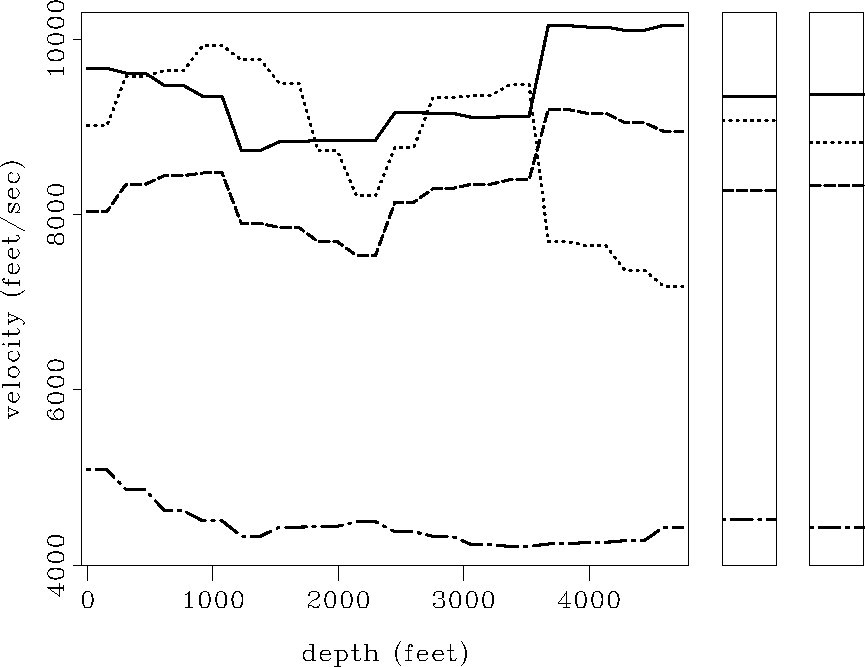
To select the traveltimes, I used an automatic-picking algorithm, which was based on an properly weighted correlation between the estimated wavelets and each trace of the decomposed wavefield. Figure 2 shows the results of the homogeneous and layered inversions of the P and SV traveltimes. Both wave-types show a considerable degree of elliptic anisotropy (more than 15 percent in average). The results of the layered inversion for Vx are substantially more stable than the ones for Vz, which starts to show an oscillatory behavior at iterations of high order. If we look however at the fourth iteration (dotted lines) we can see some consistence between VPz, VPx and VSVz, for the region above 3500 feet.
Using the results of the inversion I calculated (except for an unknown density factor) 4 of the elastic parameters that characterize a transversely isotropic medium. This evaluation was based in a paraxial approximation of the transverse isotropic dispersion relations, around the horizontal axis (Karrembach, 1989). Since the density is unknown, I have decided to express the results, in terms of the square-roots of parameter/density ratios to keep the velocity dimension. The paraxial fitting relations are
 |
(9) | |
| (10) |
![]()
Figure 3 shows these 4 parameters evaluated with the results of the homogeneous and layered inversion. For the homogeneous case I present two results: one obtained with the use of all the receivers, and the other with a limited number of receivers (30 degrees of aperture) to assure the validity of the paraxial approximation. For the layered inversion I used the solution of the fourth iteration since Vx is more stable here than at later iterations.
I must observe, however, that the results of the heterogeneous inversion are not completely reliable for this particular dataset, because only traveltimes from a single receiver were available, and therefore, many different models could fit the data equally well.
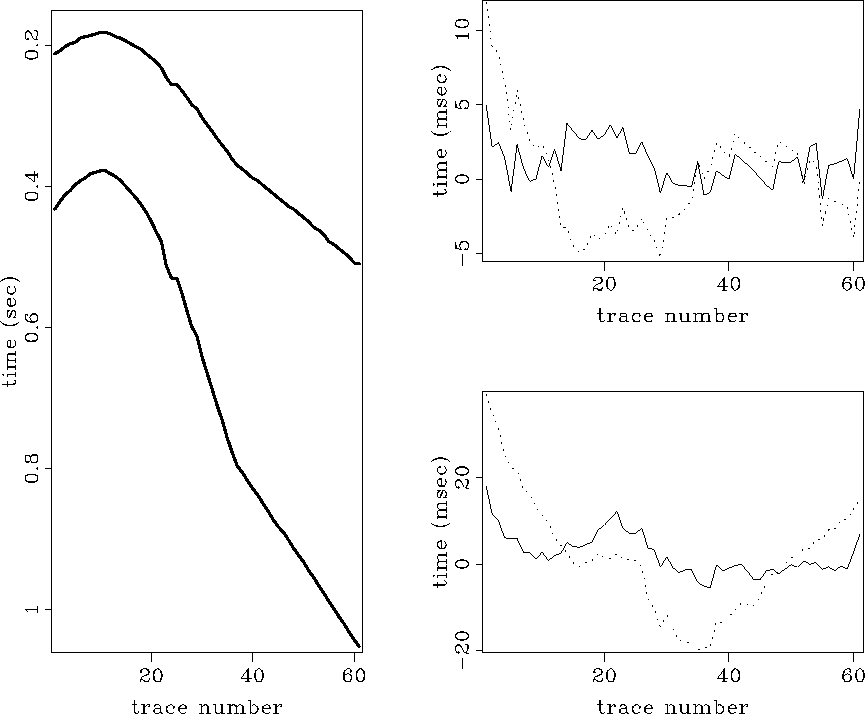
Although we cannot trust the degree of resolution expressed by the results of the layered inversion, the traveltimes predicted by the heterogeneous model fit the measured traveltimes better than the traveltimes predicted by the homogeneous model, as shown in Figure 4. The constant-time step that appears at trace 25 corresponds to two shots at the same location.
 |

 |
 |