

Next: ESTIMATING A NEW SLOWNESS
Up: THE DATASET AND ITS
Previous: THE DATASET AND ITS
vozkm.raw
Figure 4 The velocity model, a function of depth only, used for the
initial prestack migration of the dataset.

I constructed a crude interval velocity model that varied
with depth only from
the stacking velocities on the paper plot that came with the data tapes.
Figure 4 shows the velocity model.
I migrated all constant-offset sections
with this velocity. The migrated constant-offset sections
were binned into groups of three and stacked, reducing
the data volume and improving signal/noise. The resulting
sections were saved to be used for velocity analysis.
Figure 5 shows the stack of the nearest three migrated constant-offset
sections.
The pull-up
effect of the high-velocity dome
on the bottom of salt reflector is still evident because
the interval velocity model used for migration didn't ``know" about
the salt.
mig.co.inner.raw
Figure 5 Migrated and stacked section obtained from the 3 nearest offsets.
Partial stacking was used to reduce
the data volume and because the individual constant-offset sections
are spatially aliased.
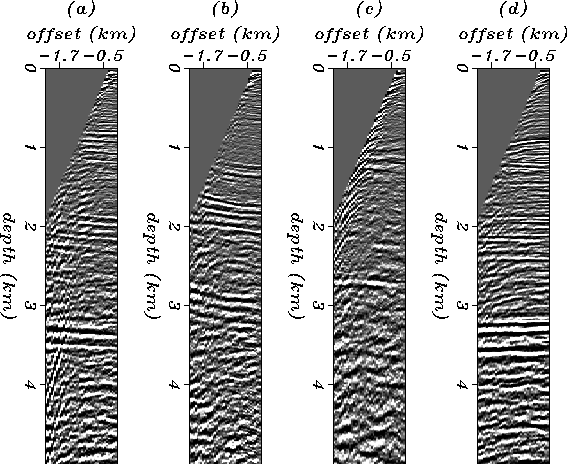
 mig.cmps.combined
Figure 6 Four post-migration common-midpoint gathers. Each displays
a different amount of residual moveout and different signal/noise ratio.
(a) is the midpoint at 13.3 km; (b) is the midpoint at 15.6 km; (c) is the
midpoint at 19.8 km; (d) is the midpoint at 25.3 km.
 mig+stack.raw
Figure 7 Stacked section of all migrated constant-offset sections. Even
though residual moveout is large for some midpoints, prominent
reflectors can still be identified.

Figure 6 shows four selected post migration common-midpoint gathers.
Varying amounts of residual moveout are evident. The signal
quality of the base-of-salt reflection is poor for the midpoint
beneath the thickest part of the dome, but hopefully there
will be enough velocity information to get a meaningful
update from the inversion algorithm.
Figure 7 shows the stack of migrated constant-offset sections. Despite
the velocity errors evident in Figure 6, prominent events can
still be identified.
This illustrates one of the advantages of using an intermediate
quantity like residual NMO+DMO stacking velocity (Etgen, 1989) over directly
picking event locations.
It would be difficult to pick robustly
the images of reflectors on individual sections; stacking
can improve
the reliability of the velocity information in the data. This
will be even more evident on the residual NMO+DMO semblance panels in
Figure 8.


Next: ESTIMATING A NEW SLOWNESS
Up: THE DATASET AND ITS
Previous: THE DATASET AND ITS
Stanford Exploration Project
1/13/1998


