

Next: Two homogeneous anisotropic examples
Up: EXAMPLES
Previous: EXAMPLES
Figure 2 shows three examples of finite-difference traveltimes
in homogeneous media.
For the moment limit your attention to the top plot, which
shows an isotropic medium. The wavefronts in this example
are nearly circular, but they are not as accurate as the example in
Figure 3 of Van Trier and Symes (page 49 of this report).
homo
Figure 2
Finite-difference traveltime calculations for three different
homogeneous media.
The ``*'' shows the position of the source,
the thin lines show equally spaced traveltime contours, and
the thick dashed curve shows a theoretical contour for
comparison.

There are several reasons for this.
We used extrapolation in z instead of r, which is not as accurate
for near-circular wavefronts. It especially has trouble at the top
of the model, where the extrapolation is (almost) at right angles
to the wave propagation direction.
Calculating the initial boundary conditions is harder when extrapolating
in z, too. Our model shows a ``bump'' directly under the source.
This is due to the
initial discontinuity in  at the source.
The initial
error at z=0 is propagated along
when we integrate
  over z to
get the final result
  , causing
the vertical line of ``bumps'' under the source.
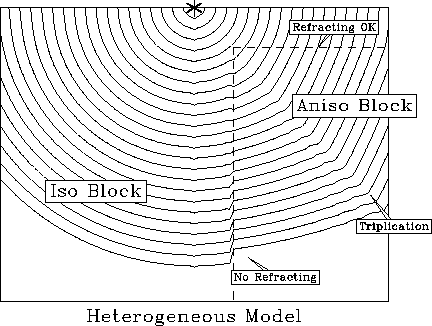
hetero
Figure 3
A heterogeneous example. The top and left part of the model are isotropic.
The block on the right is very anisotropic.


Next: Two homogeneous anisotropic examples
Up: EXAMPLES
Previous: EXAMPLES
Stanford Exploration Project
1/13/1998

