

Next: DISCUSSION
Up: SCHOENBERG-MUIR THEORY
Previous: Running rings around Schoenberg-Muir
Perhaps the edge effects become more pronounced at higher frequencies?
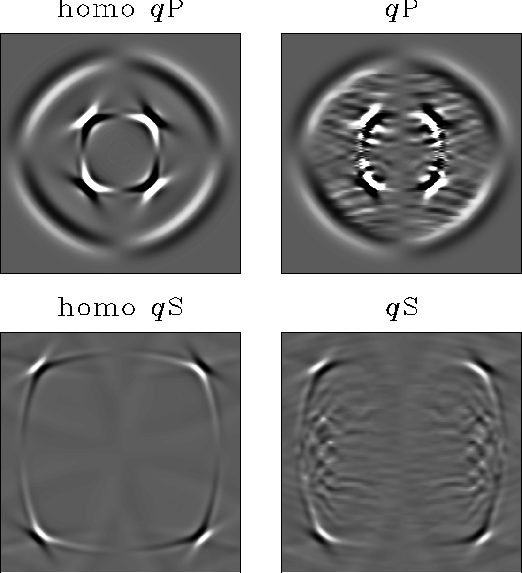
Figure 5 shows the same model as in Figure 4, but uses
a source with twice the dominant frequency.
Although the results look pretty good,
there is a significant velocity error, especially for the qS waves.
Subtracting the two wavefields in this
case is not very informative because of the resulting phase differences.
The overall shapes of the wavefronts are still correct, though.
The qP wavelength in this example is about 65 gridpoints.
By Nichols' rules of thumb (1988),
this would seem to be more than enough of a distance to average over,
since there are only
11 kinds of layers, each one gridpoint thick.
Probably this difference in results is because we used
a much more extreme variation between layers in our examples.
twelve
Figure 5
Left: Wave propagation in the homogeneous S&M medium equivalent
to the stack of layers on the right.
Right: Wave propagation in the same layered medium as in
Figure 4,
but with a higher frequency source.
The qP waves have a wavelength of about 65 gridpoints, the qS
about 35.

We know the S&M approximations break down when the layers are too thick
compared to the wavelengths of the waves passing through,
as in Figure 5.
Muir has conjectured that perhaps S&M gives an answer that is
correct in expectation in such cases.
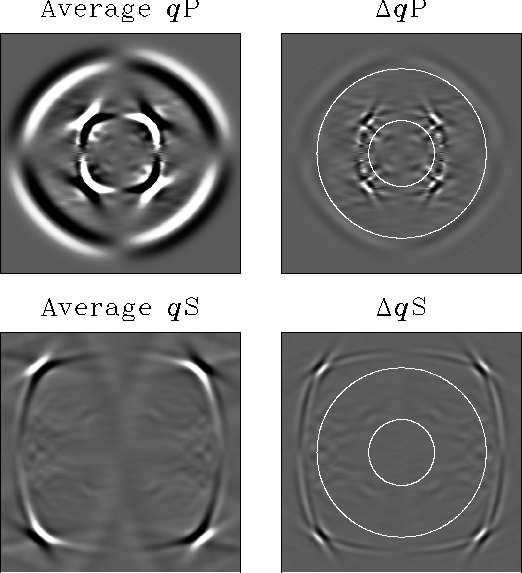
Figure 6 tests this hypothesis. To make it, we ran 20 models
similar to that
in Figure 5, but with independently chosen sets of random layers.
Because of the symmetry of the problem, we averaged in each result
and each result with the Z axis reversed, to effectively double the
number of models at no additional cost.
The results are much cleaner, but there is still a slight phase
shift that did not average out. This is especially noticeable for the
higher-frequency qS wave. (This suggests that it might be useful
to work on extending S&M theory to non-zero frequencies.)
sum
Figure 6
Left: The results of averaging 40 wavefields
like the one in Figure 5.
Right: The difference between the average wavefield on the left
and the wavefield in the homogeneous S&M equivalent model.


Next: DISCUSSION
Up: SCHOENBERG-MUIR THEORY
Previous: Running rings around Schoenberg-Muir
Stanford Exploration Project
1/13/1998

