|
|
|
|
Six tests of sparse log decon |
We thank Bob Clapp for extracting for us 2-D constant-line data sets from a 3-D data set here at SEP. Unfortunately that data turned out to be uninteresting.
We gratefully acknowledge Steve Holbrook for sending us DATA8, 11 and 12. We feel more confidence than usual that his data was unprocessed before we received it. We also gratefully thank Stew Levin for importing Holbrook's SEG-D data into the SEP system. We thank him also for reading and struggling to convert other data offered freely on the internet but which contained many glitches and ultimately turned out to be too noisy to be of interest.
|
|---|
|
DeconShort-DATA6
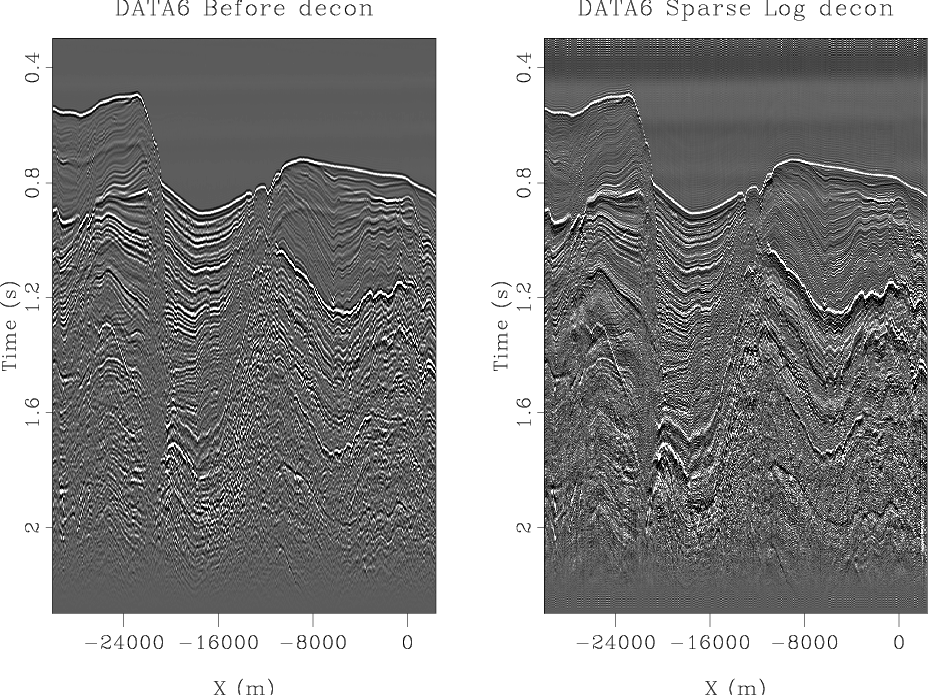
Figure 2. Data set from Baja California. The decon is bringing up some low frequencies after strong events in the water, but not after the water bottom. We observed that the Burg predictive decon does the same (not shown here). We feel this is wrong, most likely a result of this data having an unknown preprocessing history, likely a low-cut filtering of the sea swell. |
|
|
|
DeconLogFourierShort-DATA6
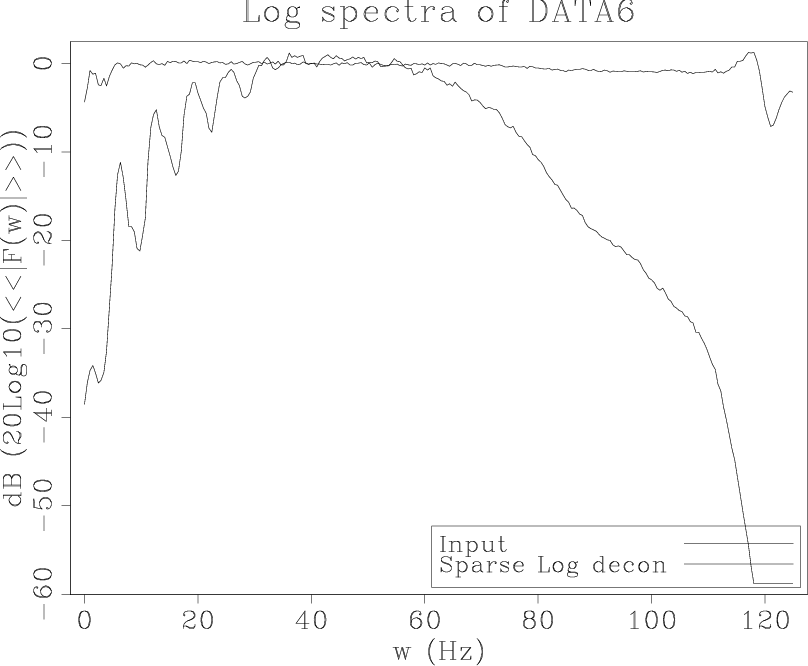
Figure 3. The data spectrum shows we have 4ms sampling. Sparse decon is almost as white as an industry PEF. |
|
|---|---|
|
|
|
Wavelet-DATA6
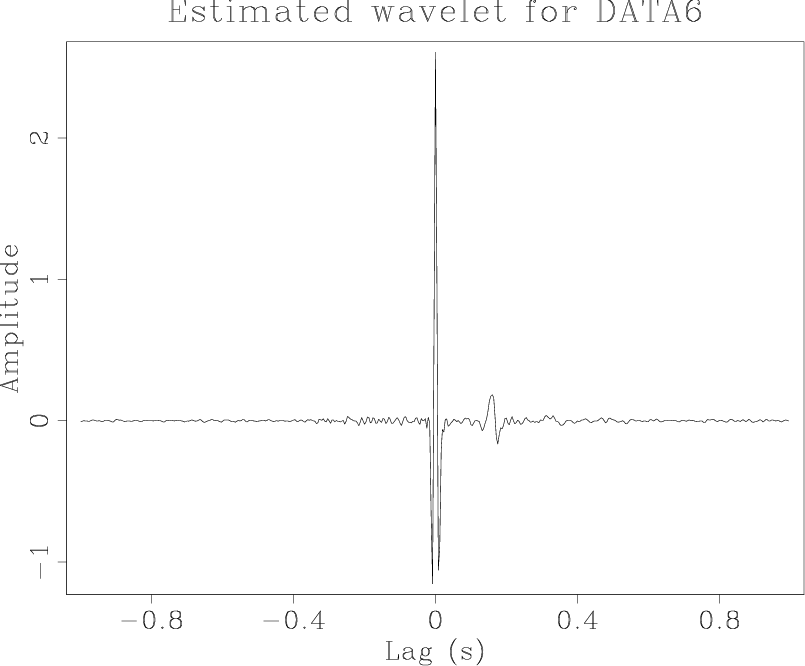
Figure 4. A shot waveform beautifully consistent with our preconceived ideas about causality, Ricker wavelets, and bubbles. |
|
|---|---|
|
|
|
|---|
|
DeconShort-DATA4
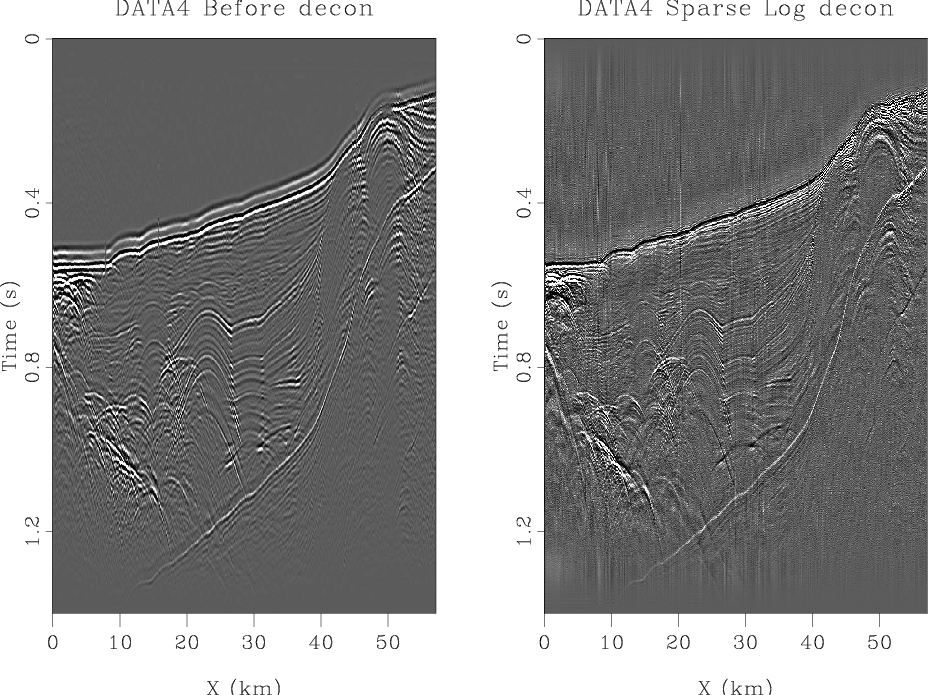
Figure 5. This data was very badly recorded (precursor to main pop) and would have been tossed out except that it very nicely demonstrates sparse decon's ability to handle a drastically non-minimum phase source. |
|
|
|
|---|
|
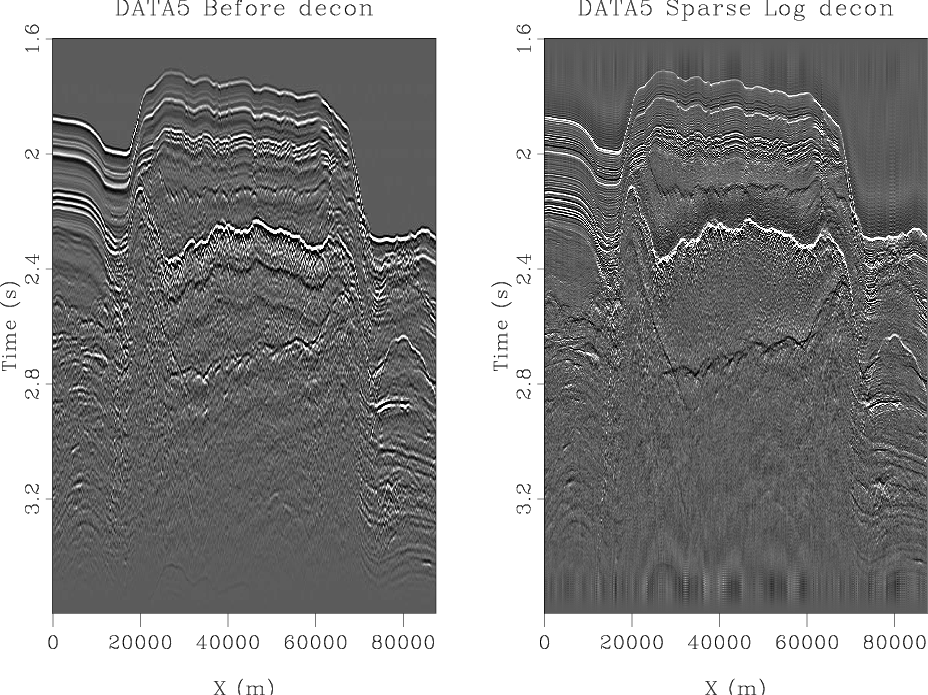
DeconShort-DATA5
Figure 6. Yang's discovery data set from the Gulf of Mexico. We love this one because it shows so clearly the opposite wave polarity (black) on the bottom of the salt ( 2.7 sec). It also shows another delightful soft layer (black), a rugose layer above the top of salt ( 2.1 sec). |
|
|
|
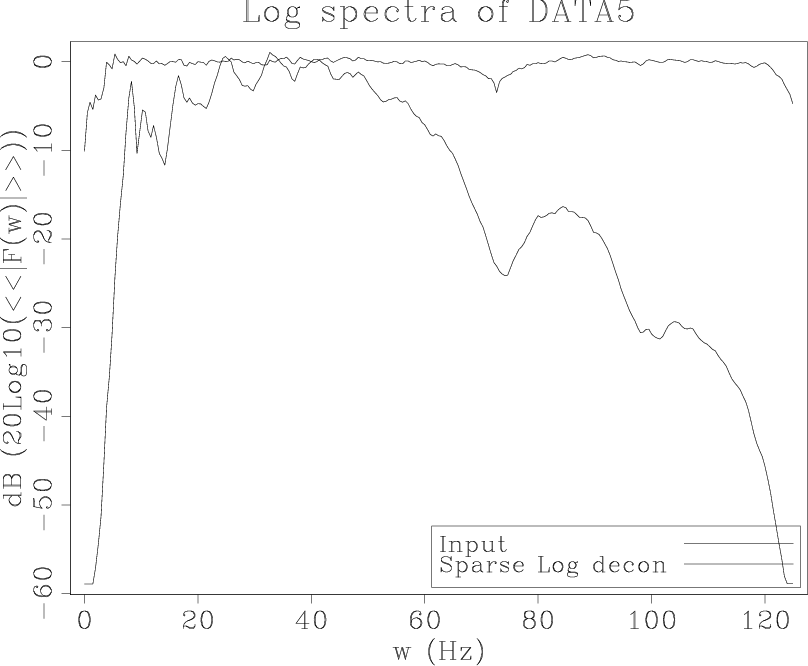
DeconLogFourierShort-DATA5
Figure 7. The data spectrum shows we have 4ms sampling. Sparse decon output is almost as white as an industry PEF decon (not shown). Again it's annoying that the sparse decon so strongly boosts very high and very low frequencies. |
|
|---|---|
|
|
|
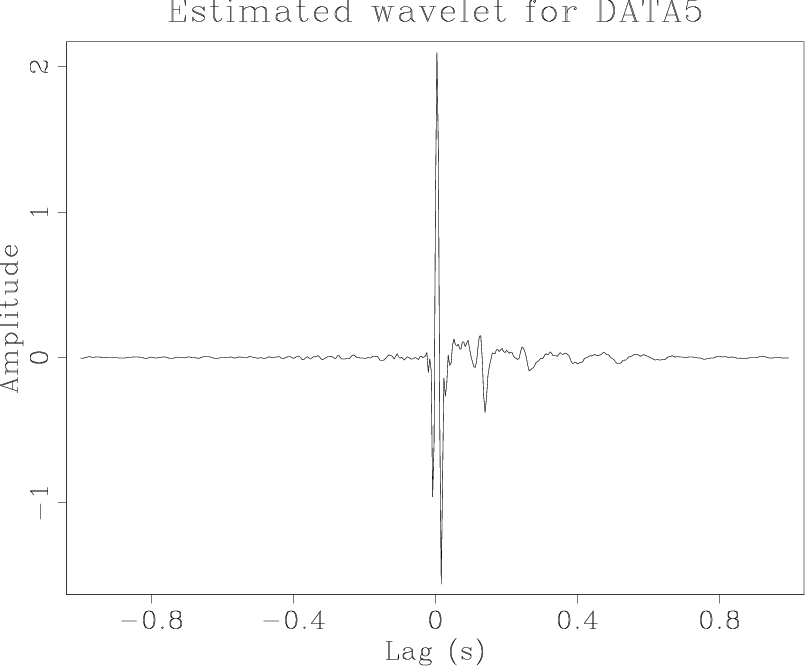
Wavelet-DATA5
Figure 8. A shot waveform with good causality and bubble, but would be improved if we were to use some of the ``Rickerness'' regularization. |
|
|---|---|
|
|

|
|---|
|
DeconShort-DATA8
Figure 9. The data set from offshore Washington. This data set misbehaves. The water bottom does not look as Ricker-like as we usually see and the sparseness decon happens to have spiked the first lobe instead of the middle lobe. So this is a case for which we might like to introduce some ``Ricker regularization''. |
|
|
|
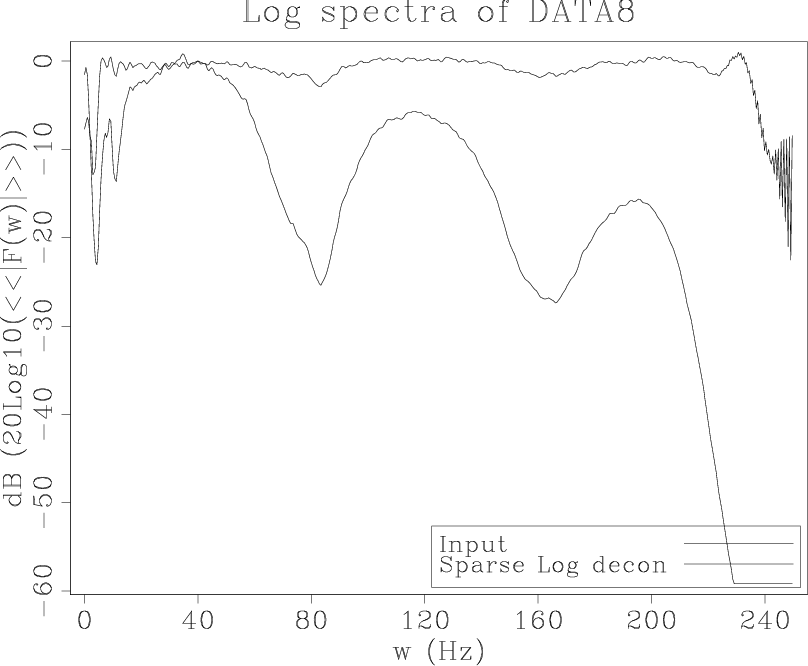
DeconLogFourierShort-DATA8
Figure 10. The spectrum shows sparse decon pulling up frequencies all the way to 240Hz. This is very suspicious! Essentially, the same result (not shown) was seen with DATA11 and DATA12. This result is unexpected to us. We suspect it means we will find such a result with almost any 2ms data set. |
|
|---|---|
|
|
|
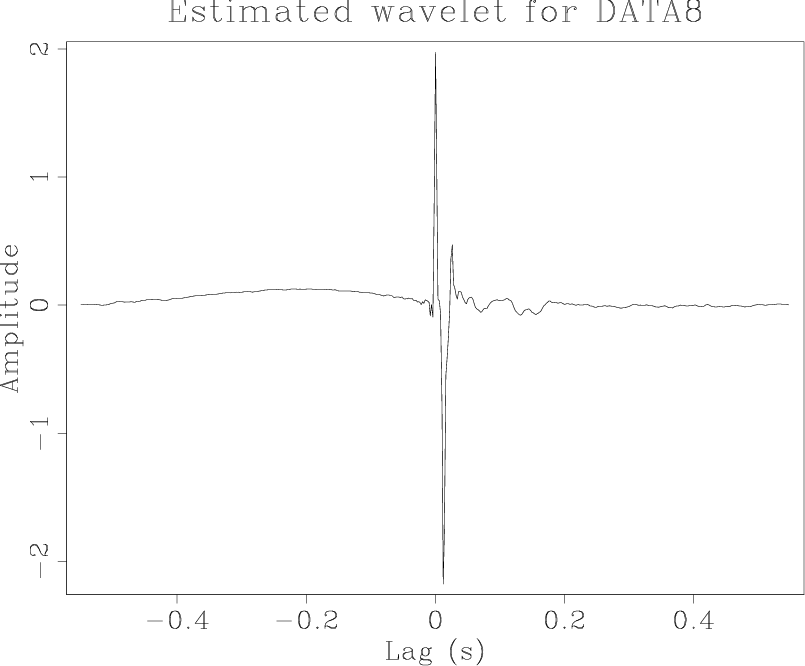
Wavelet-DATA8
Figure 11. This shot waveform is obviously wrong. Understanding why was a great boon to Jon Claerbout who has an augmented theory paper in this report. The shot waveform here appears to have a low frequency that has soaked up a lot of the ocean surface-wave frequency, a fraction of a Hertz. |
|
|---|---|
|
|
|
|---|
|
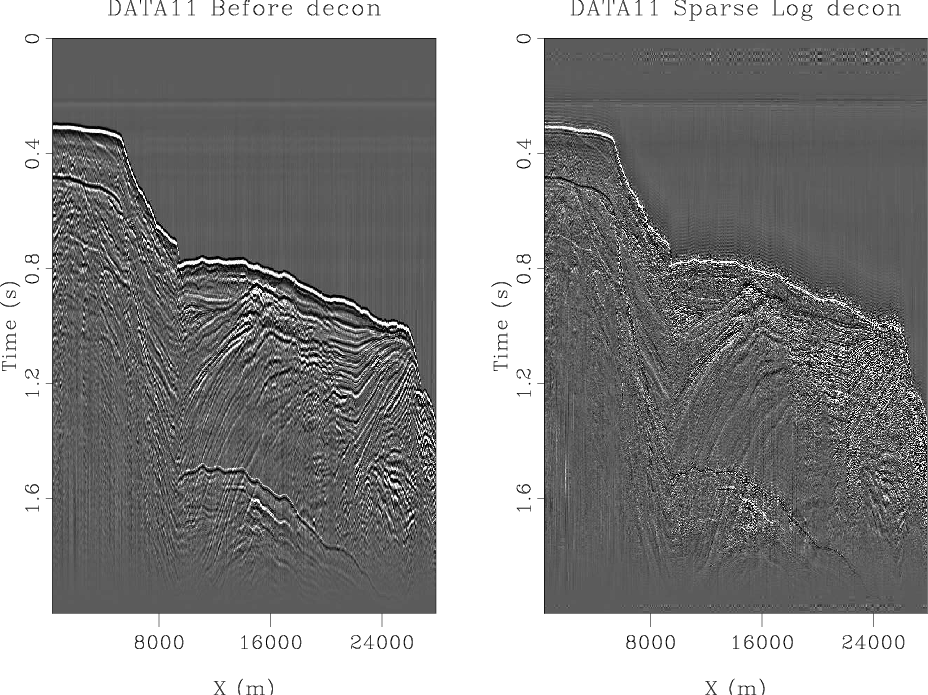
DeconShort-DATA11
Figure 12. Data set from offshore Washington. On multiples where we obviously expect to be able to recognize polarities we find them nicely enhanced by the deconvolution. Unfortunately, we don't pick up such sharp events in the sedimentary section. The sparseness decon is very high frequency, as any decon. Again, we feel the ``bad frequencies'' are coming through much more strongly than the sparseness goals suggests. |
|
|
|
|---|
|
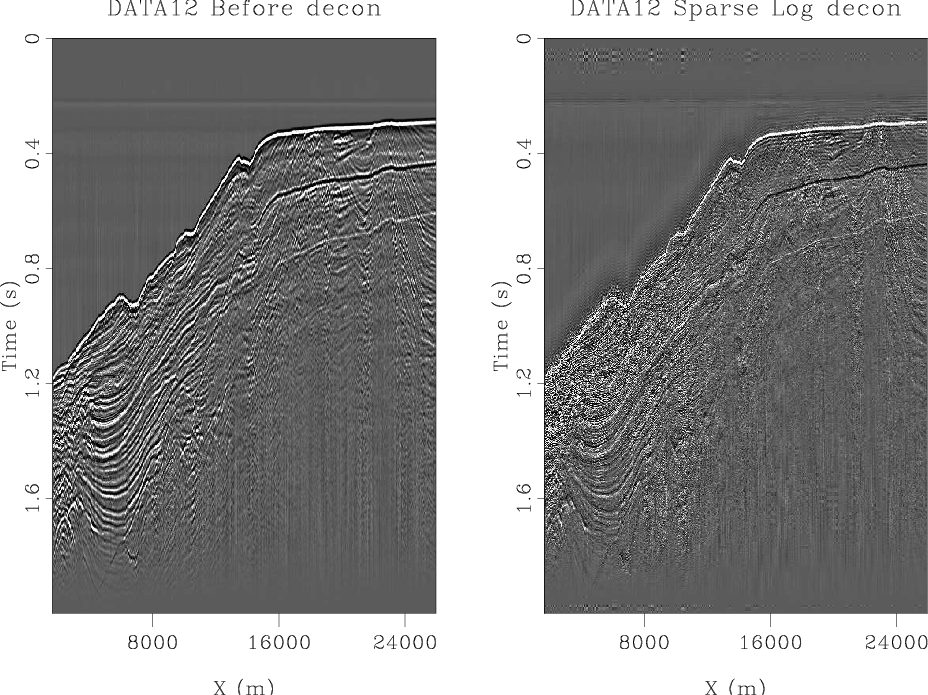
DeconShort-DATA12
Figure 13. Another data set from offshore Washington. Conclusions similar to DATA11. |
|
|
|
|
|
|
Six tests of sparse log decon |