 |
 |
 |
 | Elastic Born modeling in an ocean-bottom node acquisition scenario |  |
![[pdf]](icons/pdf.png) |
Next: Discussion and conclusions
Up: Modeling and migration results
Previous: PZ summation and imaging
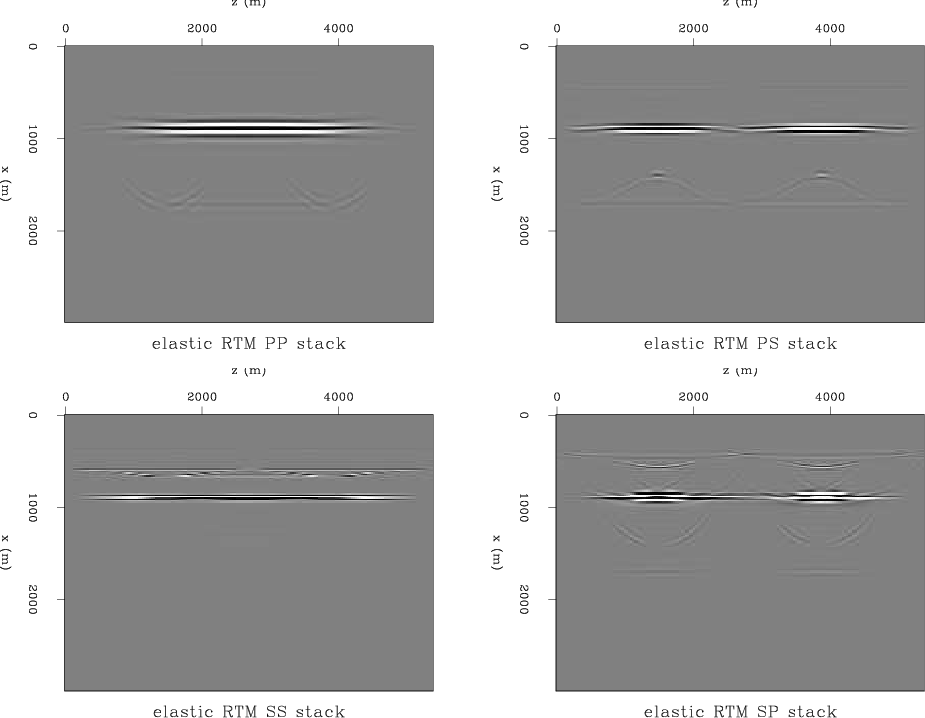
Conceivably, since the data in Figure 5 is strictly upgoing data, and is a result of elastic Born modeling, we would expect that running elastic RTM with this data as the receiver wavefield input should produce an accurate image of the subsurface. The actual imaging results of applying the vector potential imaging condition of equation 9 to the elastic source and receiver wavefields are shown in Figure 9. Notice that each of the images has its own set of artifacts. These artifacts are the result of mode conversions occuring at the injection point of particle velocities. Whenever any particle velocity value is injected into an elastic medium, both a P and an S mode will be created, regardless of whether the recorded particle velocity was the result of a pressure or a shear wave. These modes then propagate with their respective velocities in the receiver wavefield and cross-correlate with the source wavefield at locations which are not reflector positions. They can also stack coherently over shots, as is the case here. The panels in figure 9 are not plotted at the same scale. The PS stack is an order of magnitude greater than the PP and SS stacks, and two orders of magnitude greater than the SP stack.
An interesting observation is that although each of the images in Figure 9 has different artifacts, the one thing they have in common is the true reflector position. This feature could be used to attenuate some of the converted-mode artifacts. The one problem is that to use this criterion effectively, both the  and the
  models have to be quite accurate.
|
|---|
elastic-stacks
Figure 9. Images resulting from the cross-correlation of P/S source wavefield with the P/S receiver wavefield. Elastic RTM is run and the both the Born-modeled hydrophone and geophone data are injected. Top left: PP stack. Top right: PS stack. Bottom left: SS stack. Bottom right: SP stack.
 The PS stack is an order of magnitude greater than the PP and SS stacks, and two orders of magnitude greater than the SP stack. All images have artifacts resulting from mode conversion generated at the receiver injection point. Note however that all images show the true reflector position in addition to their respective artifacts.
|
|---|
![[png]](icons/viewmag.png)
|
|---|
|
|
|
|
| Elastic Born modeling in an ocean-bottom node acquisition scenario | |
|
Next: Discussion and conclusions
Up: Modeling and migration results
Previous: PZ summation and imaging
2011-09-13