next up previous [pdf]

Next: Generating initial image gathers Up: Tang and Biondi: 3-D Previous: Theory

3-D field-data examples

We apply the target-oriented wavefield tomography to a data set acquired from the Gulf of Mexico (GOM). The data set was acquired using a narrow-azimuth towed streamer (NATS) acquisition system, and further rotated using azimuth moveout (AMO) (Biondi et al., 1998) into zero azimuth. The minimum and maximum inline offsets are $0.3$ km and $8.2$ km, respectively. The frequency content of the data set ranges between $5$ Hz and $35$ Hz. The initial 3-D velocity model is shown in Figure 1. Velocities above the target (outlined by a black box) and the salt interpretation are known to be accurate. The goal is to invert for subsalt velocities inside the target region. The initial velocities inside the box are set to be $v(z)$.

bpgom3d-bvel-full
bpgom3d-bvel-full
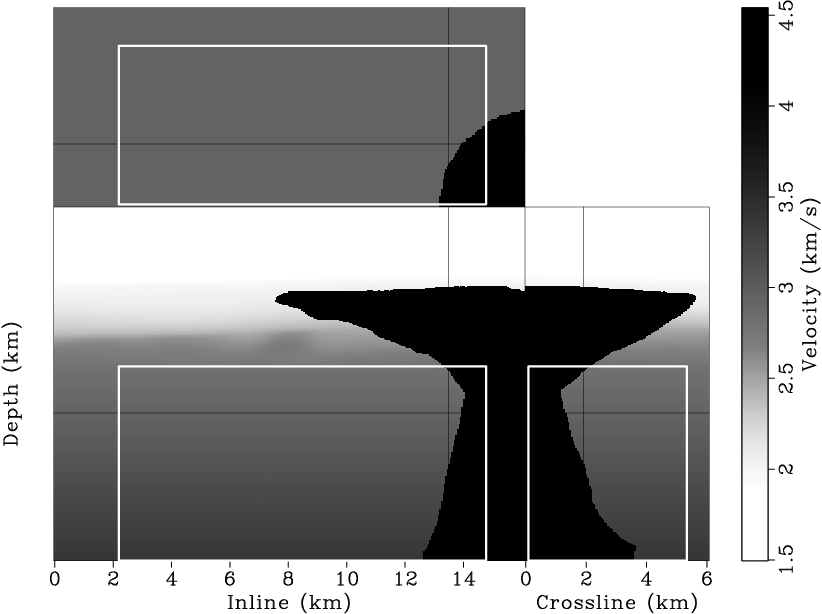
Figure 1.
The initial 3-D velocity model. The black box outlined area is the target region for velocity analysis. Velocities above the target region and the salt interpretation are known to be accurate. [ER]
[pdf] [png]


Subsections
next up previous [pdf]

Next: Generating initial image gathers Up: Tang and Biondi: 3-D Previous: Theory

2011-05-24