|
|
|
|
Ambient seismic noise eikonal tomography for near-surface imaging at Valhall |
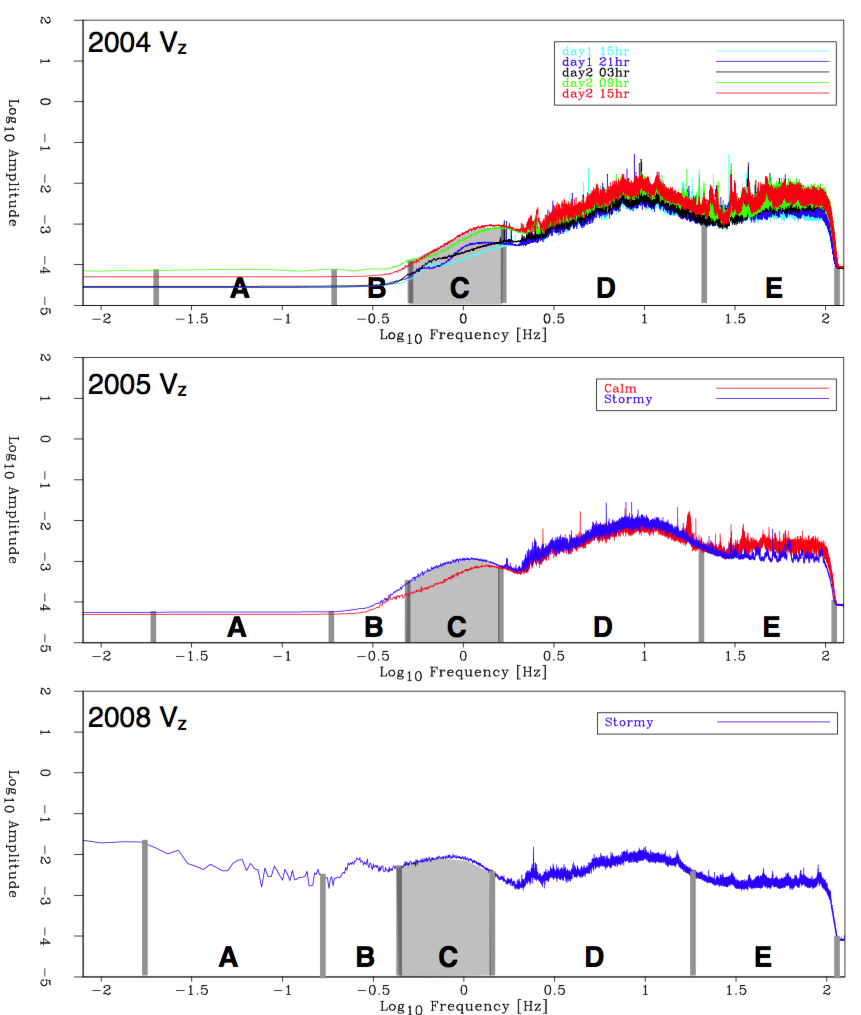
Bands D (1.75-18 Hz) and E (![]() 18 Hz) contain human-generated noise associated with field
operations, boats and distant seismic shooting. Note that repetitive artificial sources can be
identified by the spiky character of their spectra. Natural sources are more
random and result in relatively smooth spectra. When weather is calm and the microseism
peak is weak, human-generated noise sources overwhelm the microseism energy at the upper end
of the microseism band. This pushes the upper limit of useful microseism energy down during
calm weather conditions. Thus ambient seismic-noise data is best recorded during stormy
conditions and/or during periods with few noise-making field operations.
18 Hz) contain human-generated noise associated with field
operations, boats and distant seismic shooting. Note that repetitive artificial sources can be
identified by the spiky character of their spectra. Natural sources are more
random and result in relatively smooth spectra. When weather is calm and the microseism
peak is weak, human-generated noise sources overwhelm the microseism energy at the upper end
of the microseism band. This pushes the upper limit of useful microseism energy down during
calm weather conditions. Thus ambient seismic-noise data is best recorded during stormy
conditions and/or during periods with few noise-making field operations.
Weather records (NMI, 2011) indicate that the 2005 recording began in calm weather that then transitioned to stormy, a change that is readily apparent in the change in the spectrum over time windows. Weather records for the 2004 dataset are not available, but the data show that the 2004 dataset started under weather conditions even calmer than the start of the 2005 dataset, and ended under weather conditions somewhat less stormy than at the end of the 2005 dataset. Comparing the spectrum of the (unfiltered) 2008 recording with the (filtered) 2004 and 2005 recordings shows that the low-cut filter suppresses much of the microseism band of interest. In this paper we wish to compare results for all three datasets, and so we will perform our analysis for energy in frequency band C, between 0.35-1.75 Hz. Band C is highlighted in Figure 1. Seismic interferometry for microseism energy also succeeds in band B for the 2008 recording (Dellinger and Yu, 2009; Dellinger et al., 2010).
|
|---|
|
Valhall-AMS-Spectra
Figure 1. Frequency spectra of the vertical component of the particle velocity for the 2004 (top panel), 2005 (middle panel) and 2008 (bottom panel) datasets. We divide the data into five frequency bands labeled A to E. Band A ( |
|
|
|
|
|
|
Ambient seismic noise eikonal tomography for near-surface imaging at Valhall |