|
|
|
|
Low frequency passive seismic interferometry for land data |
|
|---|
|
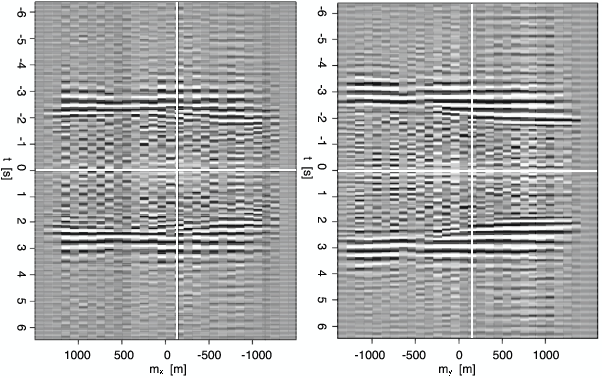
Mvariability
Figure 9. Two slices through a cube of retrieved Green's functions as a function of midpoints, for fixed full radial offset of |
|
|
|
|---|
|
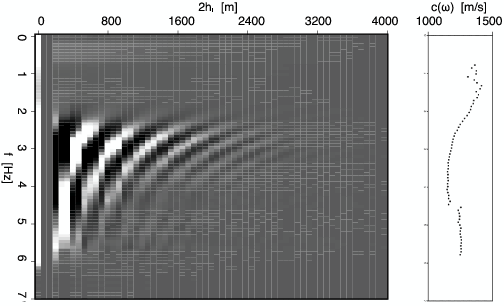
CSdispersion
Figure 10. Left; real part of the retrieved Green's functions in the frequency-domain, shown as function of full radial offset, averaged over all midpoints. Right; estimated dispersion curve for the retrieved Green's functions shown in the left panel. |
|
|
|
|
|
|
Low frequency passive seismic interferometry for land data |