 |
 |
 |
 | Delayed-shot migration in TEC coordinates |  |
![[pdf]](icons/pdf.png) |
Next: 3D Wide-azimuth synthetic tests
Up: 3D Implicit finite-difference extrapolation
Previous: 3D Implicit finite-difference extrapolation
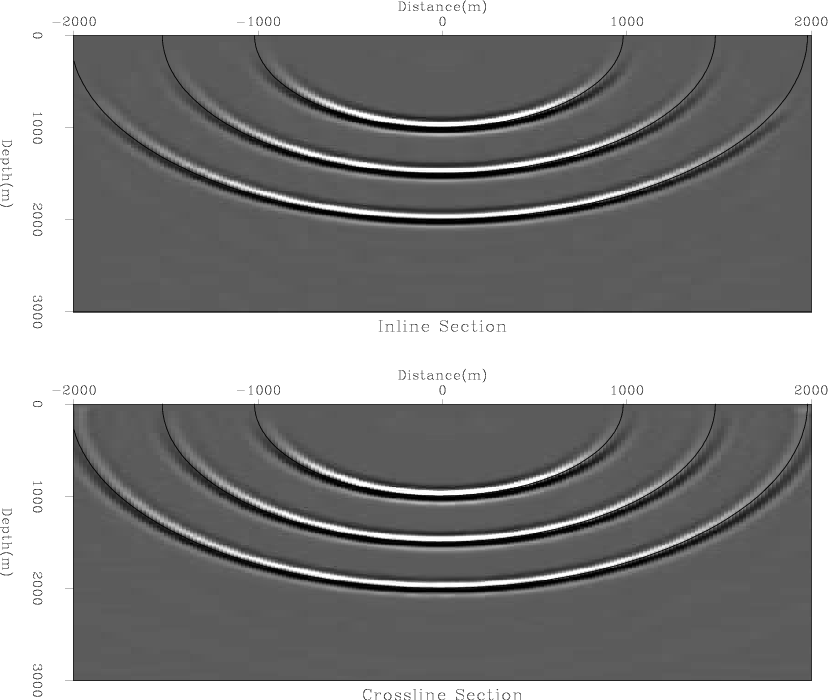
I conducted impulse response tests on a 500x400x400 cube in a homogeneous medium of slowness  sm
sm . The initial wavefield consisted of three horizontally smoothed point sources at
  =0.5, 0.75, and 1 s. The impulse responses are expected to consist of three hemispherical surfaces of radii
  =1000, 1500, and 2000 m.
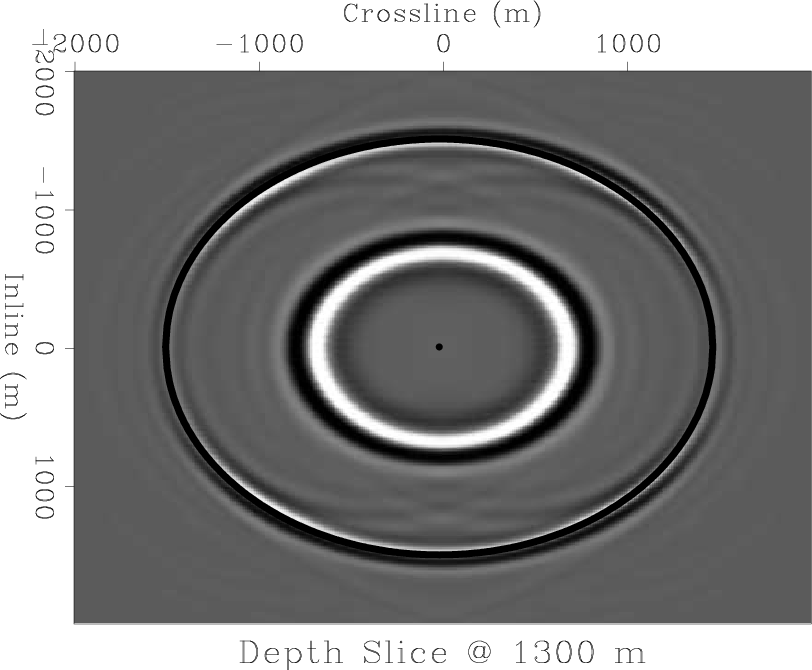
Figures 3a and 3b show the inline and crossline responses. The three lines overlying the analytic curves show the correct impulse response locations. Note that the impulse responses are restricted at large angles both by the coordinate system boundaries and by the 50 sample cosine-taper function along the edges of the TEC mesh. Figure 4 shows a impulse response slice extracted at 1300 m depth. The symmetric response indicates that the numerical anisotropy from the numerical splitting is accounted for by the Li phase-correction filter.
|
|---|
CrossIn
Figure 3. Elliptical-cylindrical-coordinate
impulse-response tests. a) Inline section. b) Crossline section. CR
|
|---|
![[png]](icons/viewmag.png)
|
|---|
Depth1300
Figure 4. Elliptical-cylindrical impulse response at 1300 m depth. Note the circular symmetry of the impulse response indicating little-to-no numerical anisotropy.
CR
|
|
|
|
|---|
|
|
|
|
| Delayed-shot migration in TEC coordinates | |
|
Next: 3D Wide-azimuth synthetic tests
Up: 3D Implicit finite-difference extrapolation
Previous: 3D Implicit finite-difference extrapolation
2009-05-05