|
|
|
|
Seismic investigation of natural coal fires: A pre-fieldwork synthetic feasibility study. |
|
|---|
|
150sg
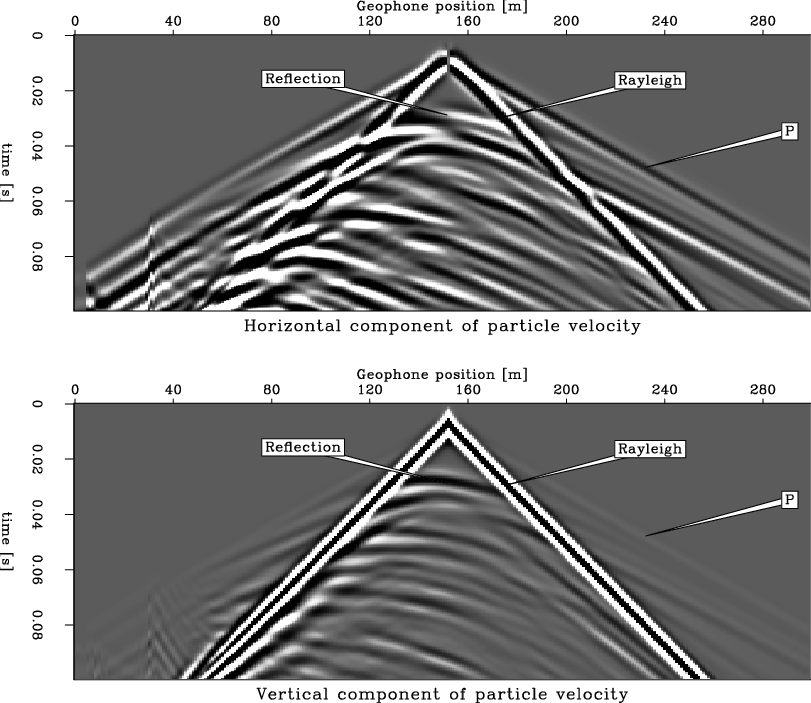
Figure 2. Shot gather for a shot at 150m. In the horizontal component, we can distinguish both the S and P surface wave. In the vertical component, we can only distinguish the Rayleigh wave. At |
|
|
|
|---|
|
0co
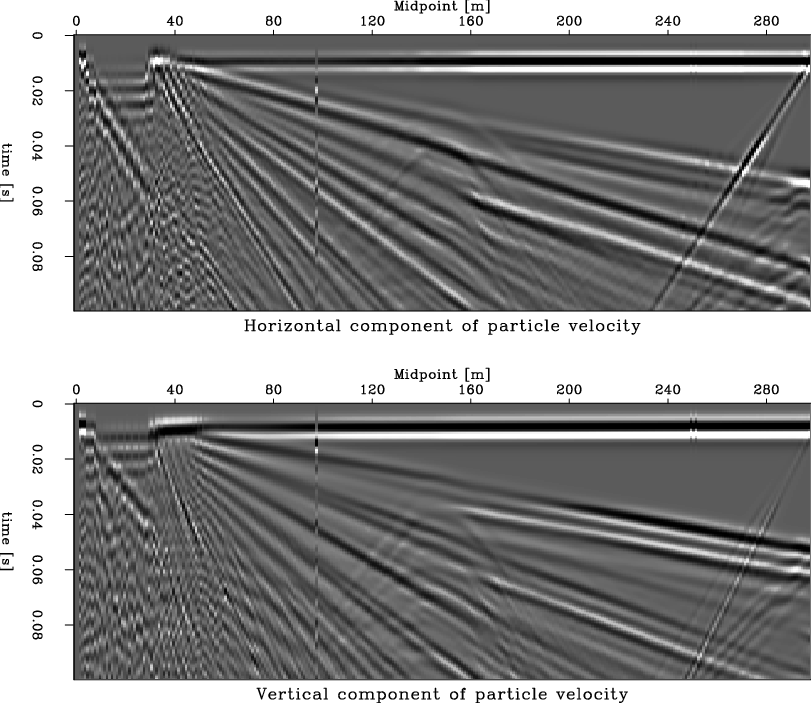
Figure 3. Zero offset gather. Clearly visible is the reflection from the top of the coal/ash layer. Less clearly and almost unseparated is the reflection from the bottom of the coal layer, the bottom of the ash layer is not visible. Weak diffractions from the ash-edge are visible. [CR] |
|
|
Figure 2 shows a pair of shot gathers for a shot at
position 150 m, directly over the end of the burn front. The
reflection arriving at ![]() 0.03 s at zero offset is the reflection
from the top of the coal seam. The reflection from the base of the
coal very closely follows the reflection from the top, and the two
interfere. Multiples dominate the remainder of the record. In the common-offset domain (Figure
3) we see clear, though faint, diffractions from the end
of the coal and note that the reflection from the base of the coal/ash
layer is difficult to discern here as well. To the right of 150 m,
the reflections from the top and bottom of the coal combine to create
the observed pattern of interfering surface and reflected waves. To the left of 150 m, the basal reflection is
obscured by the multiples. At 150 m, we can just see the basal
reflection diving away due to velocity pull-down. The jumbled patterns at
the left end of the shot gather and common-offset gather are observed
where the ash layer crops out at the surface.
0.03 s at zero offset is the reflection
from the top of the coal seam. The reflection from the base of the
coal very closely follows the reflection from the top, and the two
interfere. Multiples dominate the remainder of the record. In the common-offset domain (Figure
3) we see clear, though faint, diffractions from the end
of the coal and note that the reflection from the base of the coal/ash
layer is difficult to discern here as well. To the right of 150 m,
the reflections from the top and bottom of the coal combine to create
the observed pattern of interfering surface and reflected waves. To the left of 150 m, the basal reflection is
obscured by the multiples. At 150 m, we can just see the basal
reflection diving away due to velocity pull-down. The jumbled patterns at
the left end of the shot gather and common-offset gather are observed
where the ash layer crops out at the surface.
|
|---|
|
ZOsect
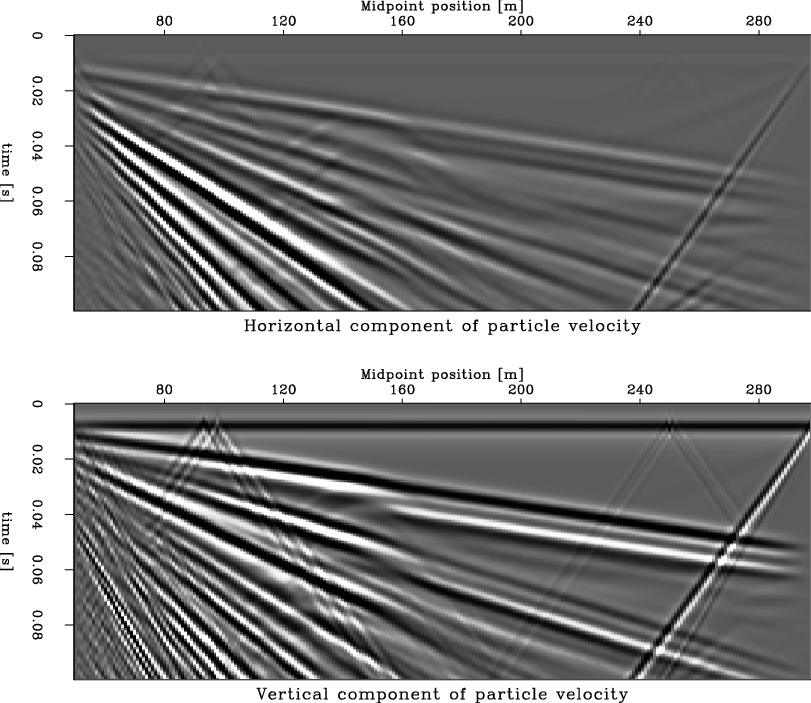
Figure 4. Stacked section, after surface wave removal and NMO correction. The bottom of the coal layer is visible, but clearly overlaps with the reflection from the top of the coal layer. [CR] |
|
|
|
|---|
|
ZOsectF
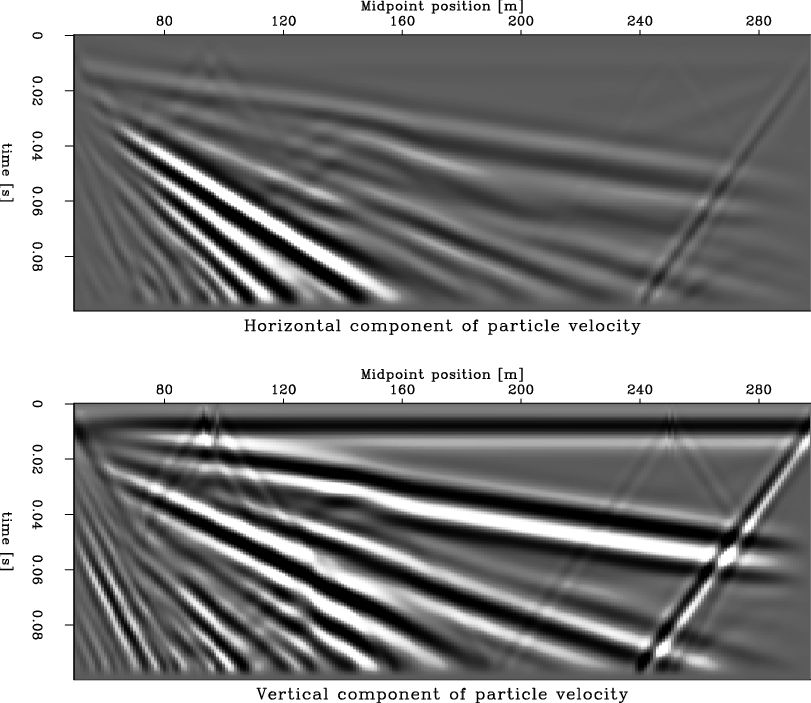
Figure 5. Stacked section, after surface wave removal and NMO correction. Data are bandpass-filtered to 100 Hz to more accurately represent possible data. The bottom of the coal layer, and the difference between coal and ash, is no longer visible. [CR] |
|
|
A quick processing flow (![]() -
-![]() filter with high-cut of
filter with high-cut of
![]() for surface waves, and with NMO
correction but no DMO or migration) yields the stacked section in Figure 4.
The reflection from the top of the coal/ash layer is clearly
observed. The slight lateral change observed at position 150 m is due
to the change from ash to coal, and represents the velocity pull-down
of the basal reflection where low-velocity ash exists. Left of 150 m
the observed reflection is due only to the top of the coal/ash layer. Right of
150 m the reflection is due to both the top and bottom of the coal.
for surface waves, and with NMO
correction but no DMO or migration) yields the stacked section in Figure 4.
The reflection from the top of the coal/ash layer is clearly
observed. The slight lateral change observed at position 150 m is due
to the change from ash to coal, and represents the velocity pull-down
of the basal reflection where low-velocity ash exists. Left of 150 m
the observed reflection is due only to the top of the coal/ash layer. Right of
150 m the reflection is due to both the top and bottom of the coal.
Figure 5 shows a stacked section low-pass filtered with 100 Hz, to show what we might see for a lower source bandwidth. It is important to note that 100 Hz is still at the high end of what can reliably be expected with a sledgehammer (e.g., Miller et al., 1992; Miller et al., 1994). The reflections for the top and bottom of the coal are much more difficult to resolve from each other, and would be very difficult to interpret.
|
|
|
|
Seismic investigation of natural coal fires: A pre-fieldwork synthetic feasibility study. |