|
|
|
|
An image-focusing semblance functional for velocity analysis |
I define
![]() as an ensemble of
prestack images obtained by residual prestack migration
where the parameter
as an ensemble of
prestack images obtained by residual prestack migration
where the parameter ![]() is the ratio between the new migration
velocity and the migration velocity used for the initial migration.
The aperture angle is
is the ratio between the new migration
velocity and the migration velocity used for the initial migration.
The aperture angle is ![]() and
and
![]() is the vector of spatial coordinates, where
is the vector of spatial coordinates, where ![]() is depth and
is depth and
![]() is the horizontal location.
is the horizontal location.
I define the image window
![]() as:
as:
| (1) |

|
|---|
|
Probl-4700-diffr-overn
Figure 3. (a) Graph of the varimax norm as a function of |
|
|

|
|---|
|
Probl-4700-trunc-overn
Figure 4. (a) Graph of the varimax norm as a function of |
|
|
The varimax norm computed for
![]() is defined as:
is defined as:
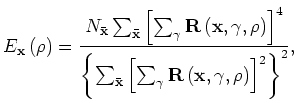 signifies summation over all the image
points in
signifies summation over all the image
points in
For the first data set (Figure 1,)
I computed the varimax in equation 2 as
a function of ![]() in two windows: the first centered on
the point diffractor, the second centered on
the reflector truncation.
Figure 3 shows the following four plots
for the point-diffractor window:
a) the graph of the varimax norm as a function of
in two windows: the first centered on
the point diffractor, the second centered on
the reflector truncation.
Figure 3 shows the following four plots
for the point-diffractor window:
a) the graph of the varimax norm as a function of ![]() ,
b) the stacked section for
,
b) the stacked section for ![]() ;
that is, the window of the initial undermigrated section
in Figure 1b,
c) the stacked section for
;
that is, the window of the initial undermigrated section
in Figure 1b,
c) the stacked section for
![]() ;
that is; for the peak of the curve shown in
Figure 3a,
and d) the angle-domain common image gather
for the same value of
;
that is; for the peak of the curve shown in
Figure 3a,
and d) the angle-domain common image gather
for the same value of
![]() and extracted from the prestack
cube at the horizontal location of the point diffractor.
and extracted from the prestack
cube at the horizontal location of the point diffractor.
Figure 4
shows analogous plots as the ones shown in the previous figure,
but for the reflector-truncation window.
Figure 4a
shows the graph of the varimax as a function of ![]() .
Figure 4b
shows the stacked section for
.
Figure 4b
shows the stacked section for ![]() .
Figure 4c
shows the stacked section for
.
Figure 4c
shows the stacked section for ![]() ;
that is,
for the peak of the curve shown in
Figure 4a,
whereas
Figure 4d
shows the angle-domain common image gather
for the same value of
;
that is,
for the peak of the curve shown in
Figure 4a,
whereas
Figure 4d
shows the angle-domain common image gather
for the same value of ![]() and extracted from the prestack
cube at the horizontal location of the reflector's truncation.
and extracted from the prestack
cube at the horizontal location of the reflector's truncation.
For both windows,
the maximum of the varimax norm
corresponds to the value of ![]() that best focuses
the prestack image and best flattens the angle-domain common image gathers.
The semblance peak for the point diffractor is sharper than for
the reflector truncation, suggesting that point diffractors
provide higher-resolution information on migration
velocity than reflectors' truncations.
that best focuses
the prestack image and best flattens the angle-domain common image gathers.
The semblance peak for the point diffractor is sharper than for
the reflector truncation, suggesting that point diffractors
provide higher-resolution information on migration
velocity than reflectors' truncations.
I also computed the varimax in equation 2 as
a function of ![]() in two windows of the prestack
migrated image corresponding to the sinusoidal reflector
(Figure 2.)
The first window is centered on the bottom
of the syncline and the second centered on the top of the anticline.
Figure 5 and
Figure 6 show:
a) graphs of the varimax as function of
in two windows of the prestack
migrated image corresponding to the sinusoidal reflector
(Figure 2.)
The first window is centered on the bottom
of the syncline and the second centered on the top of the anticline.
Figure 5 and
Figure 6 show:
a) graphs of the varimax as function of ![]() ,
b) the stacked sections corresponding the correct values of
,
b) the stacked sections corresponding the correct values of ![]() (
(![]() for Figure 5b and
for Figure 5b and
![]() for Figure 6b,)
c) the stacked sections corresponding the the varimax peaks
(
for Figure 6b,)
c) the stacked sections corresponding the the varimax peaks
(![]() for Figure 5c and
for Figure 5c and
![]() for Figure 6c,)
and d) the angle-domain common image gathers
extracted at the very bottom of the syncline in
Figure 5d
and top of the anticline in
Figure 6d.
for Figure 6c,)
and d) the angle-domain common image gathers
extracted at the very bottom of the syncline in
Figure 5d
and top of the anticline in
Figure 6d.

|
|---|
|
Probl-4250-overn
Figure 5. (a) Graph of the varimax norm as a function of |
|
|

|
|---|
|
Probl-4750-overn
Figure 6. (a) Graph of the varimax norm as a function of |
|
|
For the first window,
the peak of the varimax
corresponds to a value of ![]() that is too low,
whereas for the second window
the peak of the varimax
corresponds to a value of
that is too low,
whereas for the second window
the peak of the varimax
corresponds to a value of ![]() that is too high.
The cause of these errors is that
the image of concave reflectors can be made more spiky
(i.e. lower entropy)
by undermigration than by migration with the correct velocity.
Similarly, the image of a convex reflector
can be made more spiky
by overmigration than by migration with the correct velocity.
If the varimax norm were used to determine the residual-migration
parameter
that is too high.
The cause of these errors is that
the image of concave reflectors can be made more spiky
(i.e. lower entropy)
by undermigration than by migration with the correct velocity.
Similarly, the image of a convex reflector
can be made more spiky
by overmigration than by migration with the correct velocity.
If the varimax norm were used to determine the residual-migration
parameter ![]() it would lead to images with wrong structure and
non-flat common-image gathers.
However,
the secondary peaks of the varimax norm in
both
Figure 5 and
Figure 6
are approximately located at the correct value of
it would lead to images with wrong structure and
non-flat common-image gathers.
However,
the secondary peaks of the varimax norm in
both
Figure 5 and
Figure 6
are approximately located at the correct value of ![]() .
This secondary peaks indicate that there is potentially
useful focusing information in the images,
but to be practically useful we must devise a method
that is not biased by the reflectors' curvature.
.
This secondary peaks indicate that there is potentially
useful focusing information in the images,
but to be practically useful we must devise a method
that is not biased by the reflectors' curvature.
|
|
|
|
An image-focusing semblance functional for velocity analysis |