Next: Acknowledgments
Up: Subsalt reservoir monitoring: Ayeni
Previous: Discussion
Sub-salt reservoir monitoring of hydrocarbon reservoirs is a major challenge. We propose the computation of the time-lapse image either as a difference
between inverse images or as a solution to a least-squares inverse problem. By solving for the time-lapse response through inversion (rather than
a difference between two adjoint operations) it may be possible to obtain more reliable amplitude information and to correct for geometry
and other effects which have heretofore limited seismic monitoring of sub-salt reservoirs. Suitable regularization and/or preconditioning may
be used to better constrain the inversion result and to potentially reduce the required number of iterations in the inversion scheme. It may also be
possible to structure the regularization operator to account for geomechamical and other changes outside the reservoir.
GboyeImg
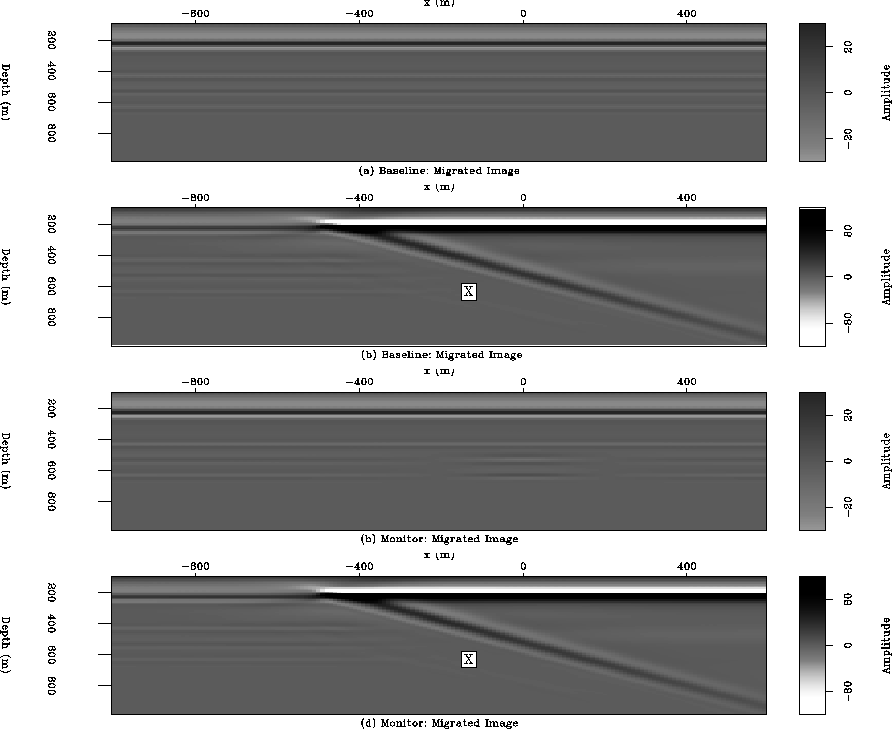
Figure 3 Migrated Images for velocity models in Figure ![[*]](http://sepwww.stanford.edu/latex2html/cross_ref_motif.gif) . Survey direction: right to left.
Data migrated using the correct (smoothed) velocity models. (a) and (b) Baseline; (c) and (d) Monitor. Notice the poor illumination of the reflectors
close to the salt flank (region marked 'X' in (b) and (d).
. Survey direction: right to left.
Data migrated using the correct (smoothed) velocity models. (a) and (b) Baseline; (c) and (d) Monitor. Notice the poor illumination of the reflectors
close to the salt flank (region marked 'X' in (b) and (d).


 GboyeImg2
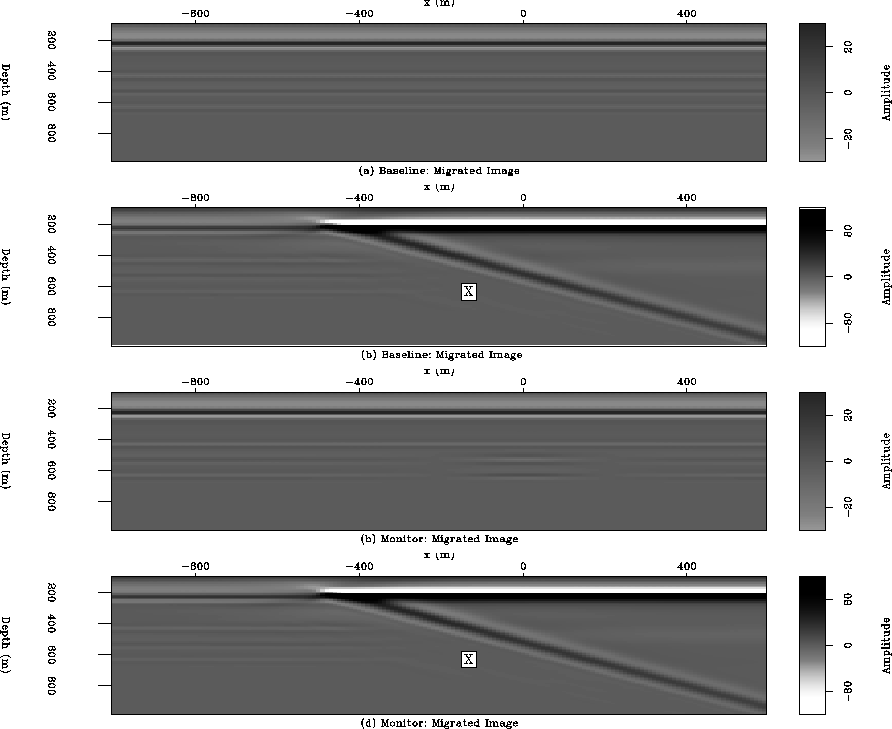
Figure 4 Migrated Images for velocity models in Figure . Survey direction: left to right.
Data migrated using the correct (smoothed) velocity models. (a) and (b) Baseline; (c) and (d) Monitor. Note the poor illumination of the reflectors
close to the salt flank (region marked 'X' in (b) and (d).
GboyeFB
Figure 5 Raw difference Images (with and without the salt wedge) for same (a and b) and opposite (c and d) acquisition directions.
Data migrated with the correct velocity models. Note the weak time-lapse response close to the reservoir (a result of the poor illumination) in the region marked 'A'.
GboyeSFB
Figure 6 Raw difference Images (with and without the salt wedge) for same (a and b) and opposite (c and d) acquisition directions.
Data migrated with the smoothed baseline velocity models. Note the differences in migration artifacts between Figures b and b in the regions marked 'B' and 'C'.
Next: Acknowledgments
Up: Subsalt reservoir monitoring: Ayeni
Previous: Discussion
Stanford Exploration Project
5/6/2007