

Next: Conclusions
Up: PS common-azimuth migration
Previous: Impulse response
After the analysis and validation of the PS-CAM operator,
I apply it to a real 3-D dataset.
I use two of the results from Chapter 4 to obtain the final image
for the 3-D OBS dataset acquired above
the Alba oil field in the North Sea.
Throughout this section,
I present and compare the result of two methods.
The conventional method, that uses Normal Moveout plus stacking to obtain
the common-azimuth data cube, followed by PS common-azimuth migration,
I refer to this method as PS-NoMoRe.
The proposed method, that uses the PS-AMO operator in the
data regularization process, as presented in
the previous chapter,
followed by PS common-azimuth migration, I refer to this method as PS-AMORe.
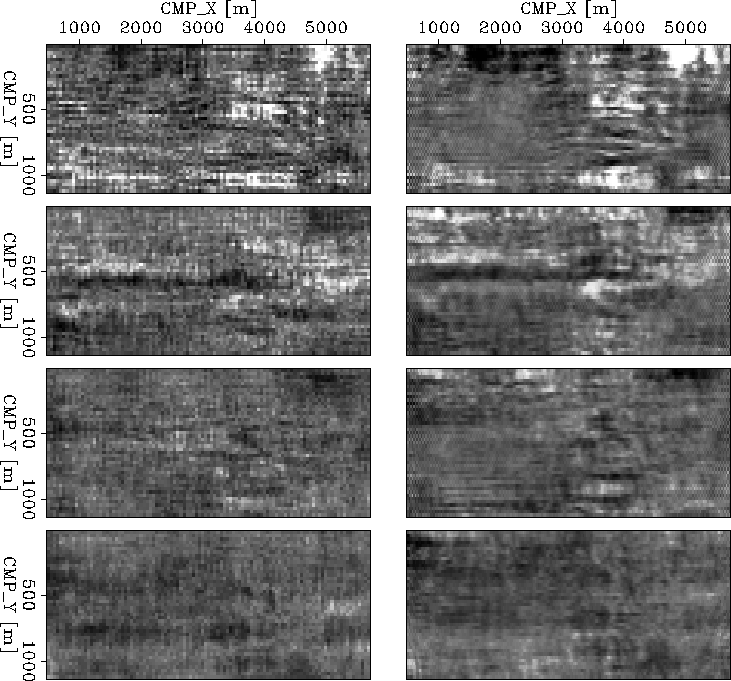
Figure ![[*]](http://sepwww.stanford.edu/latex2html/cross_ref_motif.gif) shows the first comparison between the PS-NoMoRe result (left) and
the PS-AMORe result (right). From top to bottom four depth slices at
300 m, 400 m, 500 m, 600 m, respectively. Notice how the
acquisition artifacts are stronger in the PS-NoMoRe result
than in the PS-AMORe result. At a depth of 600 m the
acquisition artifacts are no longer present after PS-AMORe.
shows the first comparison between the PS-NoMoRe result (left) and
the PS-AMORe result (right). From top to bottom four depth slices at
300 m, 400 m, 500 m, 600 m, respectively. Notice how the
acquisition artifacts are stronger in the PS-NoMoRe result
than in the PS-AMORe result. At a depth of 600 m the
acquisition artifacts are no longer present after PS-AMORe.
ps_zslice_comp2
Figure 9 Comparison
for several depth slices, of the PS-NoMoRe result (left) and
the PS-AMORe result (right). Note how the acquisition artifacts
are healed in after the PS-AMO correction and they are gone
at a shallower depth with respect to the NMO correction.


The following comparisons focus on a selected area for the
final images, the depth values were changed to relative
depth values and they do not provide any information on the
reservoir characteristics, however, the final results and
comparisons are indpendent of this modification.
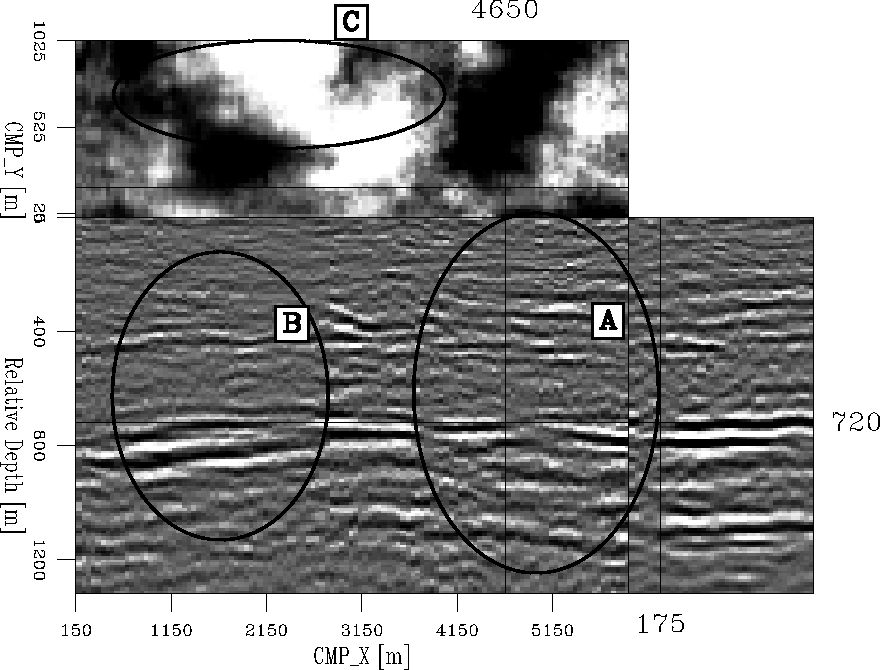
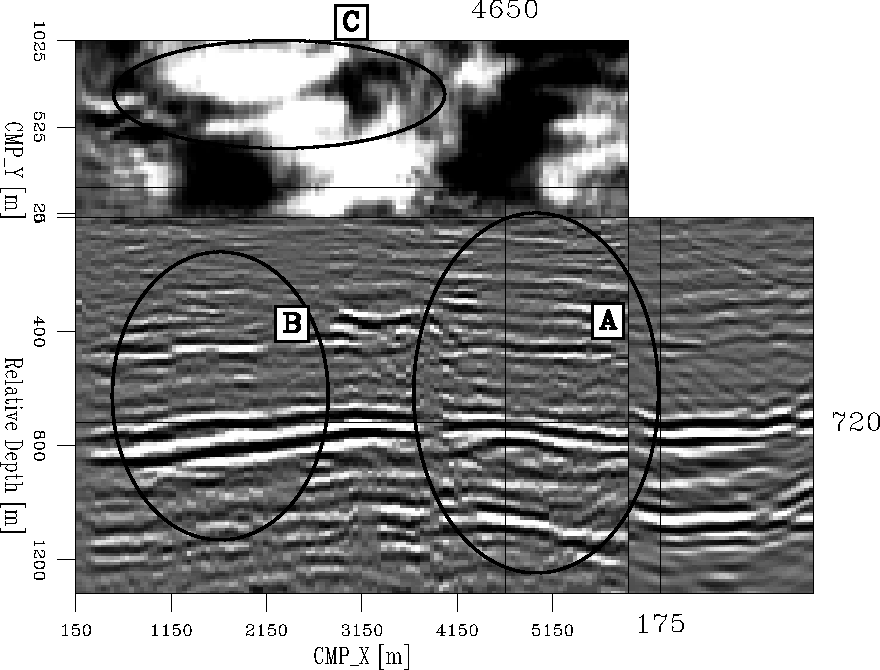
Figures ![[*]](http://sepwww.stanford.edu/latex2html/cross_ref_motif.gif) and
and ![[*]](http://sepwww.stanford.edu/latex2html/cross_ref_motif.gif) correspond to the PS-NoMoRe and the PS-AMORe results, respectively.
The ovals marked as ``A'' in the inline-midpoint sections present events
that are stronger in the PS-AMORe
result and are not present in the PS-NoMoRe result. Note at the
very top of the ovals that the reflectors are more clearly defined after PS-AMORe,
as for example, right underneath the mark ``A'', inside the ovals, the reflector
is completely clear in the PS-AMORe result, this same reflector
is difficult to follow in the PS-NoMoRe result. This is also the case for
the main event at 720 m of depth right where the inline and crossline
sections intersect. The ovals marked as ``B'' also present events
that are more continuous after PS-AMORe,
primarily
at 720 m of depth. The ovals marked as
``C'' in the depth slices shows a channel in the PS-AMORe
result that is completely lost using PS-NoMoRe.
correspond to the PS-NoMoRe and the PS-AMORe results, respectively.
The ovals marked as ``A'' in the inline-midpoint sections present events
that are stronger in the PS-AMORe
result and are not present in the PS-NoMoRe result. Note at the
very top of the ovals that the reflectors are more clearly defined after PS-AMORe,
as for example, right underneath the mark ``A'', inside the ovals, the reflector
is completely clear in the PS-AMORe result, this same reflector
is difficult to follow in the PS-NoMoRe result. This is also the case for
the main event at 720 m of depth right where the inline and crossline
sections intersect. The ovals marked as ``B'' also present events
that are more continuous after PS-AMORe,
primarily
at 720 m of depth. The ovals marked as
``C'' in the depth slices shows a channel in the PS-AMORe
result that is completely lost using PS-NoMoRe.
ps_migstk_4_ant
Figure 10 3-D image displayed
with relative depth slice at 0 m, inline section from crossline=175 m,
and crossline section from inline=4650 m. This result corresponds
to the PS-NoMoRe process.


 ps_amostk2_4_ant
Figure 11 3-D image displayed
with relative depth slice at 720 m, inline section from crossline=175 m,
and crossline section from inline=4650 m. This result corresponds
to the PS-AMORe process.


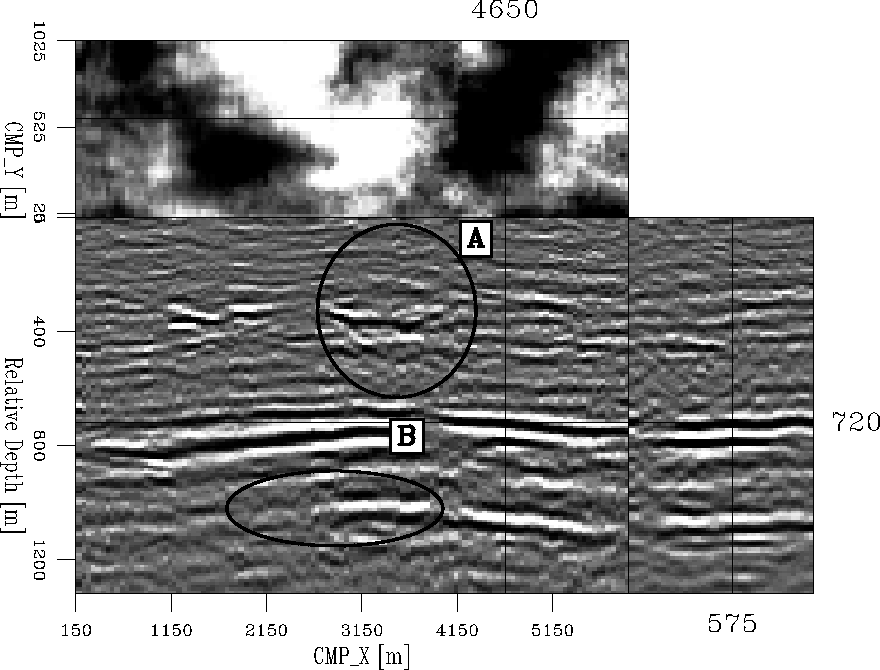
Figures ![[*]](http://sepwww.stanford.edu/latex2html/cross_ref_motif.gif) and
and ![[*]](http://sepwww.stanford.edu/latex2html/cross_ref_motif.gif) also compare PS-NoMoRe with PS-AMORe. I use a different inline-midpoint
sections taken at crossline-midpoint location of 575 m.
The conclusions from the previous comparison still holds. There
are other two areas of interest for these inline-midpoint sections.
The ovals marked as ``A'' shows ``wing'' features better defined
using PS-AMORe. This geological feature in the top sand
reflector is one of the main contributions of this dataset,
since this formation has also been confirmed with development drilling Hanson et al. (1999).
Additionally, the reflector marked by ovals ``B'' is restored after using
PS-AMORe.
also compare PS-NoMoRe with PS-AMORe. I use a different inline-midpoint
sections taken at crossline-midpoint location of 575 m.
The conclusions from the previous comparison still holds. There
are other two areas of interest for these inline-midpoint sections.
The ovals marked as ``A'' shows ``wing'' features better defined
using PS-AMORe. This geological feature in the top sand
reflector is one of the main contributions of this dataset,
since this formation has also been confirmed with development drilling Hanson et al. (1999).
Additionally, the reflector marked by ovals ``B'' is restored after using
PS-AMORe.
ps_migstk_3_ant
Figure 12 3-D image displayed
with relative depth slice at 720 m, inline section from crossline=575 m,
and crossline section from inline=4650 m. This result corresponds
to the PS-NoMoRe process.


 ps_amostk2_3_ant
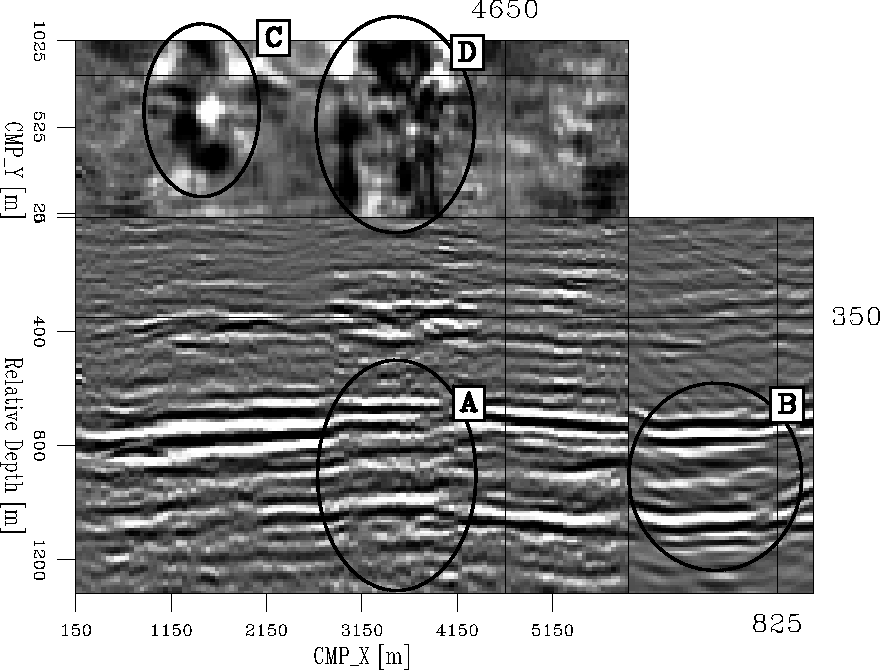
Figure 13 3-D image displayed
with relative depth slice at 720 m, inline section from crossline=575 m,
and crossline section from inline=4650 m. This result corresponds
to the Ps-AMORe process.


Figures ![[*]](http://sepwww.stanford.edu/latex2html/cross_ref_motif.gif) and
and ![[*]](http://sepwww.stanford.edu/latex2html/cross_ref_motif.gif) also compare the results for PS-NoMoRe and PS-AMORe, respectively.
The images correspond to another inline-midpoint sections for a crossline-midpoint
location of 825 m. The ovals marked as ``A'' not only shows the
reflectors with brighter amplitudes but also they are more continuous
after PS-AMORe. Along the crossline-midpoint sections, the
events are shifted laterally, because of the spatial correction
of the PS-AMO operator. These events are located at the center
of the crossline-midpoint sections, in the PS-AMORe result,
and they are not truncated at the boundary, as it is the case for
the PS-NoMoRe result. The spatial shift is more
clear in the depth slices, these are taken at a new depth (350 m).
Notice the areas marked by the ovals ``C'' and ``D''. The events
are continuous through the crossline direction in the PS-AMORe result,
whereas, the events in the PS-NoMoRe are truncated at the edges
of the crossline sections.
also compare the results for PS-NoMoRe and PS-AMORe, respectively.
The images correspond to another inline-midpoint sections for a crossline-midpoint
location of 825 m. The ovals marked as ``A'' not only shows the
reflectors with brighter amplitudes but also they are more continuous
after PS-AMORe. Along the crossline-midpoint sections, the
events are shifted laterally, because of the spatial correction
of the PS-AMO operator. These events are located at the center
of the crossline-midpoint sections, in the PS-AMORe result,
and they are not truncated at the boundary, as it is the case for
the PS-NoMoRe result. The spatial shift is more
clear in the depth slices, these are taken at a new depth (350 m).
Notice the areas marked by the ovals ``C'' and ``D''. The events
are continuous through the crossline direction in the PS-AMORe result,
whereas, the events in the PS-NoMoRe are truncated at the edges
of the crossline sections.
ps_migstk_2_ant
Figure 14 3-D image displayed
with relative depth slice at 350 m, inline section from crossline=825 m,
and crossline section from inline=4650 m. This result corresponds
to the PS-NoMoRe process.


 ps_amostk2_2_ant
Figure 15 3-D image displayed
with relative depth slice at 350 m, inline section from crossline=825 m,
and crossline section from inline=4650 m. This result corresponds
to the Ps-AMORe process.


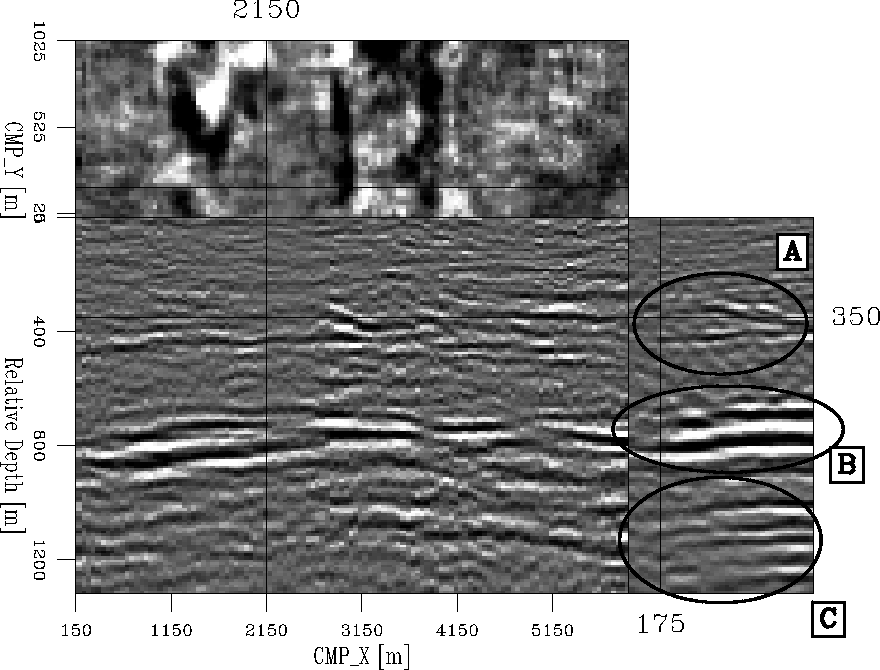
Figures ![[*]](http://sepwww.stanford.edu/latex2html/cross_ref_motif.gif) and
and ![[*]](http://sepwww.stanford.edu/latex2html/cross_ref_motif.gif) show the last comparison between the PS-NoMoRe result and
the PS-AMORe result, respectively.
I compare the crossline-midpoint sections that correspond to
inline-midpoint location of 2150 m.
The geological feature marked by ovals ``A'' is better
defined in the PS-AMORe result than in the PS-NoMoRe result.
At the reservoir level, the ovals marked as ``B'' and ``C'' show
the reservoir with better horizontal continuity and stronger
amplitudes along the crossline-midpoint section after using PS-AMORe.
show the last comparison between the PS-NoMoRe result and
the PS-AMORe result, respectively.
I compare the crossline-midpoint sections that correspond to
inline-midpoint location of 2150 m.
The geological feature marked by ovals ``A'' is better
defined in the PS-AMORe result than in the PS-NoMoRe result.
At the reservoir level, the ovals marked as ``B'' and ``C'' show
the reservoir with better horizontal continuity and stronger
amplitudes along the crossline-midpoint section after using PS-AMORe.
ps_migstk_5_ant
Figure 16 3-D image displayed
with relative depth slice at 350 m, inline section from crossline=175 m,
and crossline section from inline=2150 m. This result corresponds
to the PS-NoMoRe process.


 ps_amostk2_5_ant
Figure 17 3-D image displayed
with relative depth slice at 350 m, inline section from crossline=175 m,
and crossline section from inline=2150 m. This result corresponds
to the PS-AMORe process.


Next: Conclusions
Up: PS common-azimuth migration
Previous: Impulse response
Stanford Exploration Project
12/14/2006
![[*]](http://sepwww.stanford.edu/latex2html/cross_ref_motif.gif) shows the first comparison between the PS-NoMoRe result (left) and
the PS-AMORe result (right). From top to bottom four depth slices at
300 m, 400 m, 500 m, 600 m, respectively. Notice how the
acquisition artifacts are stronger in the PS-NoMoRe result
than in the PS-AMORe result. At a depth of 600 m the
acquisition artifacts are no longer present after PS-AMORe.
shows the first comparison between the PS-NoMoRe result (left) and
the PS-AMORe result (right). From top to bottom four depth slices at
300 m, 400 m, 500 m, 600 m, respectively. Notice how the
acquisition artifacts are stronger in the PS-NoMoRe result
than in the PS-AMORe result. At a depth of 600 m the
acquisition artifacts are no longer present after PS-AMORe.
