


The non-interaction approximation is particularly simple for the first
model since ![]() . Then, (3) and (2)
show that
. Then, (3) and (2)
show that
| |
(19) |
Without fitting
 |

|
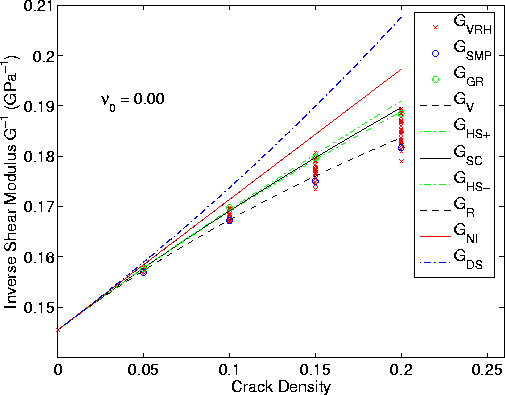
Fig3
Figure 3 Same as Figure 2, showing corresponding results for the inverse bulk modulus estimators K-1VRH . Polycrystal bounds and estimates were also obtained here without any fitting parameters, using only the very low crack density coefficients. Note that the estimates and possible bounds are considerably higher here in relation to the numerical data (x) than in Figure 2 for the inverse shear modulus. We interpret this difference as being a result of shorter range interactions for shear, and longer range interactions for bulk modulus that are not properly taken into account by the present (overly simple) model. | 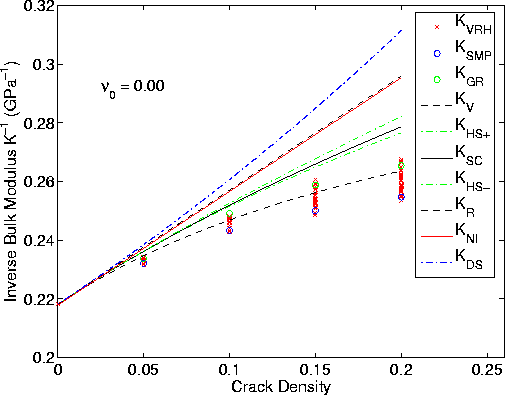 |
Figures 2 and 3 show the results for the first model using only the results of the NIA as input to the polycrystal of cracked-grains model. For comparison, we also display the NIA results, the differential scheme (DS) effective medium theory results (Zimmerman, 1991; Berryman, 2002), and the numerical data (x). The numerical data were actually stiffness matrices, so these matrices have been converted to Voigt-Reuss-Hill (VRH) estimates of shear and bulk moduli for plotting and comparison purposes. All curves converge at low crack densities as they should. We see that the numerical data deviate from the NIA curve substantially for both shear and bulk moduli. But the deviations are especially strong for the bulk modulus estimates. Without fitting, the shear modulus estimates have values that are about equal to the self-consistent polycrystal estimates, or higher (note the plots are inverse moduli). In contrast, the bulk modulus (inverse modulus) estimates are always significantly higher (lower) than the self-consistent estimates. We interpret this difference between the shear modulus and bulk modulus results as being due to the presence of longer range interactions for bulk modulus effects, and shorter range interactions for shear modulus effects. Thus, even without any attempt at fitting, the polycrystal grain model appears to be a fairly good model for the shear behavior, but not as good for the bulk (hydrostatic) behavior.
We can modify the results for the polycrystals of cracked-grains model by including higher order corrections from the Sayers and Kachanov (1991) model, as in the discussion accompanying Eqs. (38)-(41), and that is what we do next.
With fitting
|
Fig4
Figure 4 Same as Figure 2, but the values of | 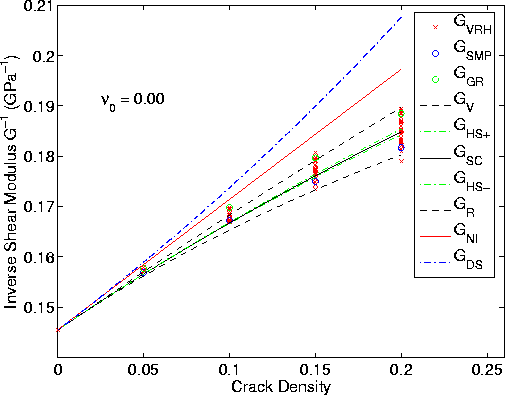 |
|
Fig5
Figure 5 Same as Figure 4, for the inverse bulk modulus. Note that the data mostly fall between the Reuss and Voigt bounds, but definitely are not close to being restricted to lie inside the HS bounds. | 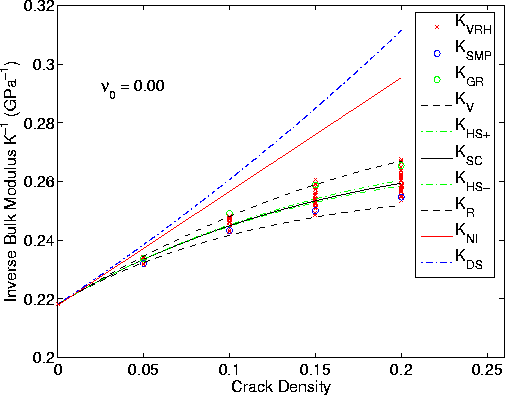 |
When developing our approach to fitting the numerical the data, we took the basic model of Sayers and Kachanov (1991), including the higher order corrections in powers of crack density, as discussed in Appendix B, and then tried to find the simplest set of coefficients that would fit the numerical data. Since the fit was already fairly good for shear modulus of the first model, and since it was mostly the bulk modulus that deviated very much from the numerical data, we determined that a method producing as little change as possible in the shear modulus, while still affecting the needed changes in bulk modulus, was what was needed.
Since ![]() for this case,
for this case, ![]() also seemed the logical
choice for this parameter. This leaves us with two crack-influence parameters
to fit:
also seemed the logical
choice for this parameter. This leaves us with two crack-influence parameters
to fit: ![]() and
and ![]() . One type of increment that produces
relatively small changes in shear modulus, while also changing bulk
modulus, is one of the form
. One type of increment that produces
relatively small changes in shear modulus, while also changing bulk
modulus, is one of the form ![]() added to S33, while at the same time adding corrections
added to S33, while at the same time adding corrections
![]() to S44 and S55. This type of shift causes no change
in the Reuss average for shear modulus. (In fact, we actually used this
approach for the quadratic corrections in the second model, as will be
seen in the subsequent discussion.) Although we tried this approach
here, it did not seem to be as successful as desired at improving the
fit to the numerical data. In particular, since the shear modulus
agreement in this case could stand some improvement anyway, we modified
this approach slightly and found (after some trial and error)
that setting
to S44 and S55. This type of shift causes no change
in the Reuss average for shear modulus. (In fact, we actually used this
approach for the quadratic corrections in the second model, as will be
seen in the subsequent discussion.) Although we tried this approach
here, it did not seem to be as successful as desired at improving the
fit to the numerical data. In particular, since the shear modulus
agreement in this case could stand some improvement anyway, we modified
this approach slightly and found (after some trial and error)
that setting ![]() worked better in this case. This choice does not leave the Reuss
average of shear modulus unchanged, but that was not an absolute
condition we needed or wanted to impose.
By choosing
worked better in this case. This choice does not leave the Reuss
average of shear modulus unchanged, but that was not an absolute
condition we needed or wanted to impose.
By choosing ![]() ,we thus obtained the agreement seen in Figures 4 and 5, and no further
searching for better fits to the data were pursued. These corrections
are translated into numerical values for
,we thus obtained the agreement seen in Figures 4 and 5, and no further
searching for better fits to the data were pursued. These corrections
are translated into numerical values for ![]() and
and ![]() in
TABLE 1.
in
TABLE 1.