| |
(1) |
Because windowing individual arrivals from the 79 Gbytes of data associated with the hydrophone measurement is impractical, it is impossible to honor equation 1 precisely by correlating traces within time windows when only a single event is active. However, this effort makes the assumption that processing data in 12 second sections is a reasonable approximation to the requirement. The available data were divided into three sections for processing: one 13.5 hours, two 9 hours, and one 4.5 hours in duration. Sequential 12 second records from all the stations were correlated in accordance with equation 1 and the results stacked over the duration of the (hours long) section of available data. Thus
| |
(2) |
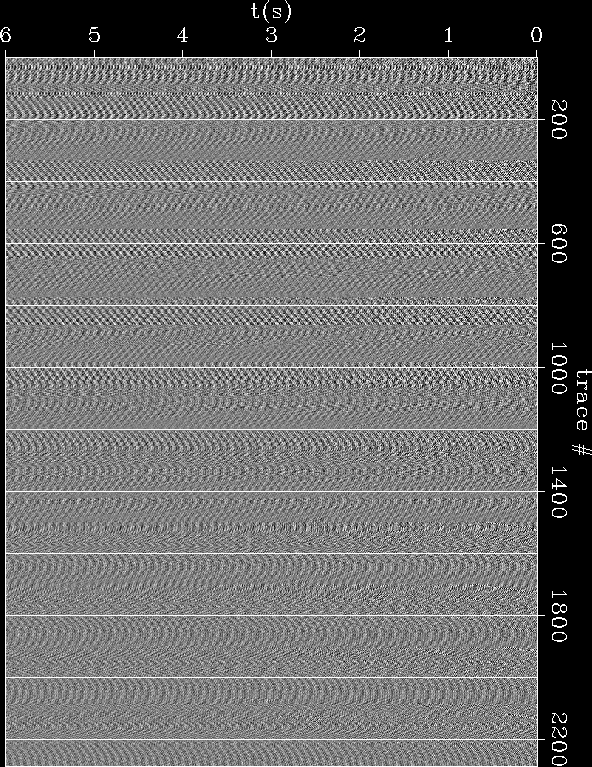
Figure ![[*]](http://sepwww.stanford.edu/latex2html/cross_ref_motif.gif) shows correlations from one of the 9 hour sections of data. A trace
from the NW corner was used to correlate all the other
traces in the array. If the processing was perfect, the figure would
show something equivalent to an off-end areal shot-gather. Energy to 60
Hz energy was used in the correlations, with cosine tapers beginning
at 3 and 57 Hz. Unfortunately, the image, and the other similar ones,
do not reveal anything of interest. Figure
shows correlations from one of the 9 hour sections of data. A trace
from the NW corner was used to correlate all the other
traces in the array. If the processing was perfect, the figure would
show something equivalent to an off-end areal shot-gather. Energy to 60
Hz energy was used in the correlations, with cosine tapers beginning
at 3 and 57 Hz. Unfortunately, the image, and the other similar ones,
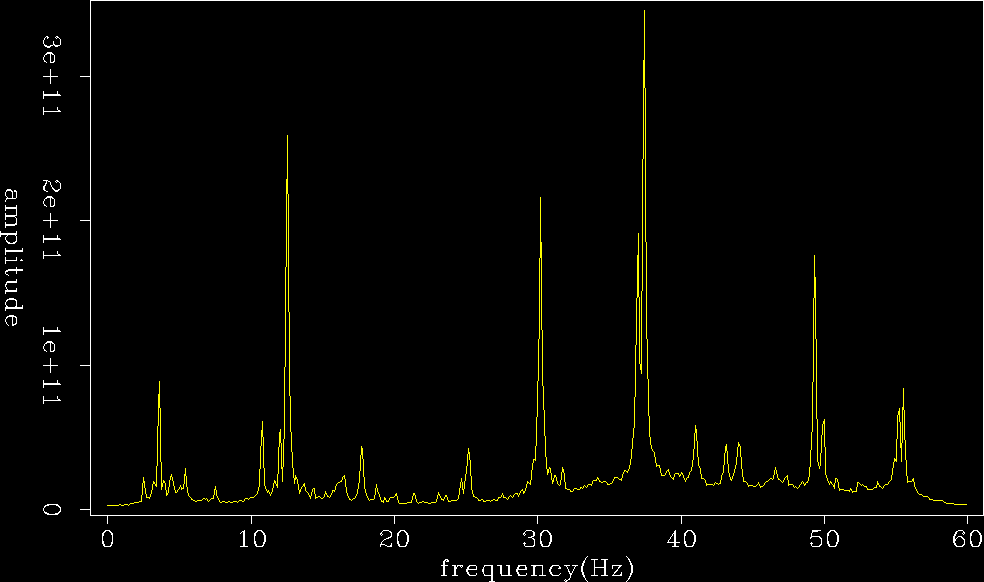
do not reveal anything of interest. Figure ![[*]](http://sepwww.stanford.edu/latex2html/cross_ref_motif.gif) plots the
power spectrum of the sum of 100 traces from the gather in
Figure
plots the
power spectrum of the sum of 100 traces from the gather in
Figure ![[*]](http://sepwww.stanford.edu/latex2html/cross_ref_motif.gif) . Versions of the data bandpassed around and
between the peaks made no appreciable increase in interpretability.
. Versions of the data bandpassed around and
between the peaks made no appreciable increase in interpretability.
 |
|
spec
Figure 8 Power spectrum of the gathers in Figure ![[*]](http://sepwww.stanford.edu/latex2html/cross_ref_motif.gif) . .
|  |
Spectral whitening by division of a trace in the frequency domain with its power produces remarkable results when compared to simple correlation. Gathers were also produced using the relation
| |
(3) |
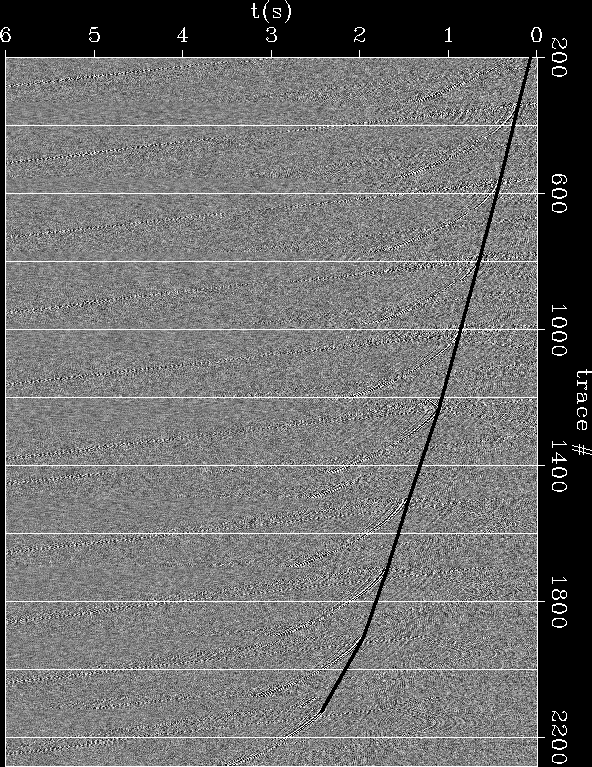
Figure ![[*]](http://sepwww.stanford.edu/latex2html/cross_ref_motif.gif) shows the same gather as in Figure
shows the same gather as in Figure ![[*]](http://sepwww.stanford.edu/latex2html/cross_ref_motif.gif) using the spectral whitening of equation 3. A very clear
event is now apparent. Similar features can be seen upon close
inspection of the correlated result after viewing the deconvolved
gather. The various features of the obvious event in the gather reveal
important features of the presumed source energy. The event is
coherent across the entire 50 km2 of the array and has reasonable
bandwidth. Versions of data were bandpassed across the intervals
between and surrounding the energy maximums in power spectrum,
Figure
using the spectral whitening of equation 3. A very clear
event is now apparent. Similar features can be seen upon close
inspection of the correlated result after viewing the deconvolved
gather. The various features of the obvious event in the gather reveal
important features of the presumed source energy. The event is
coherent across the entire 50 km2 of the array and has reasonable
bandwidth. Versions of data were bandpassed across the intervals
between and surrounding the energy maximums in power spectrum,
Figure ![[*]](http://sepwww.stanford.edu/latex2html/cross_ref_motif.gif) , of the correlated gathers. No coherent energy was
present at all through 8 Hz. Five versions from 9-40 Hz showed only
minor differences, with the strong event equally well represented. After
42 Hz, the signal begins to diminish markedly, and no coherent energy
is present at all after 52 Hz.
, of the correlated gathers. No coherent energy was
present at all through 8 Hz. Five versions from 9-40 Hz showed only
minor differences, with the strong event equally well represented. After
42 Hz, the signal begins to diminish markedly, and no coherent energy
is present at all after 52 Hz.
 |
![[*]](http://sepwww.stanford.edu/latex2html/cross_ref_motif.gif) . Line connecting
minimum travel-times almost perfectly straight.
. Line connecting
minimum travel-times almost perfectly straight.
Events are hyperbolic. This indicates the event could be
caused by any solution to the class of hyperbolic PDE's. Possible solutions
include the direct arrival of a buried source, or the reflection of a
point source from a plane. No line contains the top of the
hyperbola. This means that the source of the energy is not contained
within the area of the array. The moveout of the event is monotonic
to the South and East. This indicates that the source must be to the
North and West. Moveout is curve-linear in the inline direction, but
very close to linear in the cross-line direction. The line connecting
the minimum travel-times of the event on each cable deviates from
straight only at the far right side. Notice from the map in
Figure ![[*]](http://sepwww.stanford.edu/latex2html/cross_ref_motif.gif) that crossline offset there is twice the
normal spacing. This indicates that
the array is close to the asymptotic limit of the hyperbolic event in
the cross-line direction, and nearer the hyperbola top in the inline
direction. These two observations indicate that the source is much
closer to the array in the inline direction than the perpendicular
direction. Given the true geographical orientation of the array,
Figure
that crossline offset there is twice the
normal spacing. This indicates that
the array is close to the asymptotic limit of the hyperbolic event in
the cross-line direction, and nearer the hyperbola top in the inline
direction. These two observations indicate that the source is much
closer to the array in the inline direction than the perpendicular
direction. Given the true geographical orientation of the array,
Figure ![[*]](http://sepwww.stanford.edu/latex2html/cross_ref_motif.gif) , the source of energy should be somewhere West
of the location toward the English coast.
, the source of energy should be somewhere West
of the location toward the English coast.
The fact that the event does not contain the center of the hyperbola,
proves that processing by correlation to produce conventional
shot-gathers has failed. Specifically the requirement to sum the
correlations from many shots in equation 1 has not been
honored. If only a single shot is captured by a passively recorded
array, correlation simply shifts the event up such that it arrives at
t=0 at the source-trace used to create the gather. The moveout of
the event will not be altered at all. I believe the energy is
localized in space, but seemingly ubiquitous in
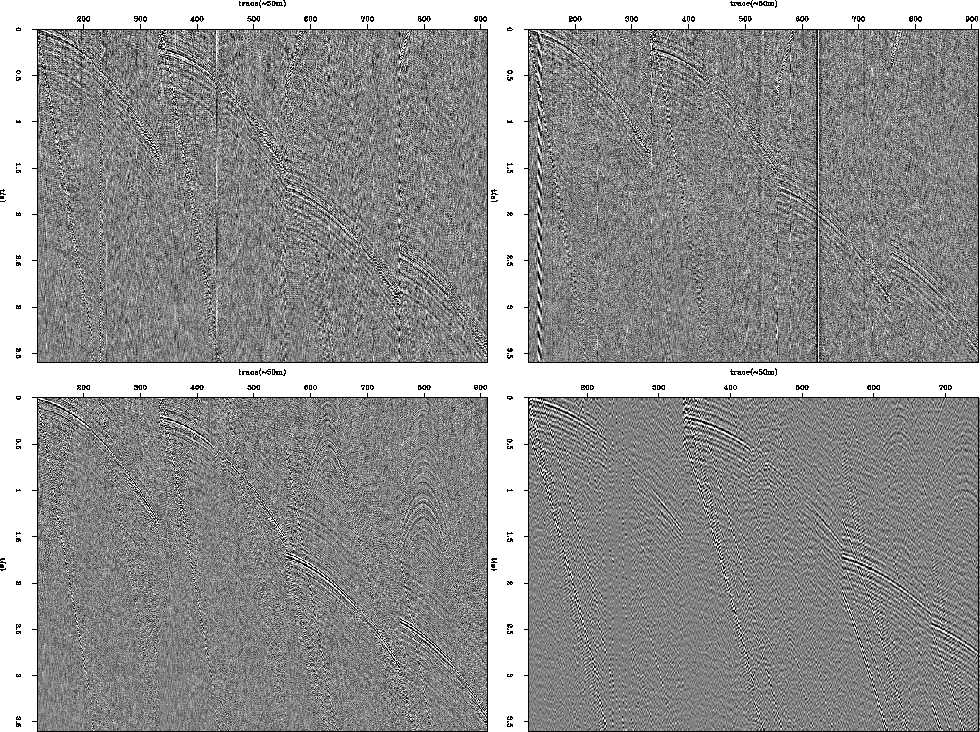
time. Figure ![[*]](http://sepwww.stanford.edu/latex2html/cross_ref_motif.gif) shows four lines from the array from the
same correlated shot-gather from the four time periods into which the
data volume was divided. The lines are the first and last two
complete receiver lines from Figure
shows four lines from the array from the
same correlated shot-gather from the four time periods into which the
data volume was divided. The lines are the first and last two
complete receiver lines from Figure ![[*]](http://sepwww.stanford.edu/latex2html/cross_ref_motif.gif) . The third panel
is a subset of the gather shown in Figure
. The third panel
is a subset of the gather shown in Figure ![[*]](http://sepwww.stanford.edu/latex2html/cross_ref_motif.gif) . Each trace was
correlated with the first trace in the panel. Thus the
event on the autocorrelated trace is at time zero. Some of the
character of the panels changes, but the presence and kinematics of
the obvious energy is the same. The last panel was computed with data
recorded almost one year after the data used in the first three panels.
. Each trace was
correlated with the first trace in the panel. Thus the
event on the autocorrelated trace is at time zero. Some of the
character of the panels changes, but the presence and kinematics of
the obvious energy is the same. The last panel was computed with data
recorded almost one year after the data used in the first three panels.
 |
![[*]](http://sepwww.stanford.edu/latex2html/cross_ref_motif.gif) .
.
Figure ![[*]](http://sepwww.stanford.edu/latex2html/cross_ref_motif.gif) shows four synthesized shot-gathers using data
shown in the previous section concerning the character of the raw
recordings. The source trace used for correlation in all panels was
the first trace on North end of line 2 (trace 119). All panels use
the deconvolutional variant of correlation described by
equation 3 and show the Eastern side of the array. The first
panel is the first three seconds of the causal lags using the data
shown in Figure
shows four synthesized shot-gathers using data
shown in the previous section concerning the character of the raw
recordings. The source trace used for correlation in all panels was
the first trace on North end of line 2 (trace 119). All panels use
the deconvolutional variant of correlation described by
equation 3 and show the Eastern side of the array. The first
panel is the first three seconds of the causal lags using the data
shown in Figure ![[*]](http://sepwww.stanford.edu/latex2html/cross_ref_motif.gif) which showed the ringing noise-train.
No strong events are present, but there are some faint ringing hyperbolas
that show water velocity.
which showed the ringing noise-train.
No strong events are present, but there are some faint ringing hyperbolas
that show water velocity.
Correlation subtracts the time to the source trace from all the other
traces in the gather. The beginning of the noise-train in
Figure ![[*]](http://sepwww.stanford.edu/latex2html/cross_ref_motif.gif) on the first trace (number 119), is at about 3.5
s. The top of the noise train on the last receiver line (trace number
2150) is at about 2 s. The complicated coda evident in the raw data
should collapse to a simple wavelet during correlation. Therefore,
we expect the top of the energy on the last receiver line to lie at
about -1.5 s. The acausal lags in the second panel of
Figure
on the first trace (number 119), is at about 3.5
s. The top of the noise train on the last receiver line (trace number
2150) is at about 2 s. The complicated coda evident in the raw data
should collapse to a simple wavelet during correlation. Therefore,
we expect the top of the energy on the last receiver line to lie at
about -1.5 s. The acausal lags in the second panel of
Figure ![[*]](http://sepwww.stanford.edu/latex2html/cross_ref_motif.gif) show exactly what was expected. Overlain on
the correlated event are time picks modeled with the same 1450 m/s
arrival used to delineate the noise-train in Figure
show exactly what was expected. Overlain on
the correlated event are time picks modeled with the same 1450 m/s
arrival used to delineate the noise-train in Figure ![[*]](http://sepwww.stanford.edu/latex2html/cross_ref_motif.gif) .
The hyperbolas ring to the bottom (t=0) of the panel. Given the
long (7 s) coda of the noise train, these are probably correlation
side-lobes that are also responsible for the events seen in the panel
to its left.
.
The hyperbolas ring to the bottom (t=0) of the panel. Given the
long (7 s) coda of the noise train, these are probably correlation
side-lobes that are also responsible for the events seen in the panel
to its left.
The bottom row of Figure ![[*]](http://sepwww.stanford.edu/latex2html/cross_ref_motif.gif) are the deconvolved
correlated gathers using trace 119 as a source and the data from
Figures
are the deconvolved
correlated gathers using trace 119 as a source and the data from
Figures ![[*]](http://sepwww.stanford.edu/latex2html/cross_ref_motif.gif) & Figure
& Figure ![[*]](http://sepwww.stanford.edu/latex2html/cross_ref_motif.gif) respectively. In
each case only 12 s of data were correlated. Faint hyperbolas are
discernible in the early time of the right side of the right panel.
The most obvious energy however is in the events
similar to the strong arrivals in Figure
respectively. In
each case only 12 s of data were correlated. Faint hyperbolas are
discernible in the early time of the right side of the right panel.
The most obvious energy however is in the events
similar to the strong arrivals in Figure ![[*]](http://sepwww.stanford.edu/latex2html/cross_ref_motif.gif) and
Figure
and
Figure ![[*]](http://sepwww.stanford.edu/latex2html/cross_ref_motif.gif) .
.
 |
![[*]](http://sepwww.stanford.edu/latex2html/cross_ref_motif.gif) .
Picks on right panel have same (1450 m/s) velocity and origin as
those delineating the top and bottom boundaries of the raw data.
Bottom row: Early causal lags of correlated gathers using data in
Figure
.
Picks on right panel have same (1450 m/s) velocity and origin as
those delineating the top and bottom boundaries of the raw data.
Bottom row: Early causal lags of correlated gathers using data in
Figure ![[*]](http://sepwww.stanford.edu/latex2html/cross_ref_motif.gif) & Figure
& Figure ![[*]](http://sepwww.stanford.edu/latex2html/cross_ref_motif.gif) .
.
Correlation masks some of the characteristics of the source energy. The
source could be impulsive or a long sweep containing many frequency
components like a vibrator source. The latter seems less likely. The
source could be a single strong event, or many similar repeated events
with low amplitude. Given the presence of the event during all the
time intervals in Figure ![[*]](http://sepwww.stanford.edu/latex2html/cross_ref_motif.gif) , I favor the latter
explanation.
, I favor the latter
explanation.
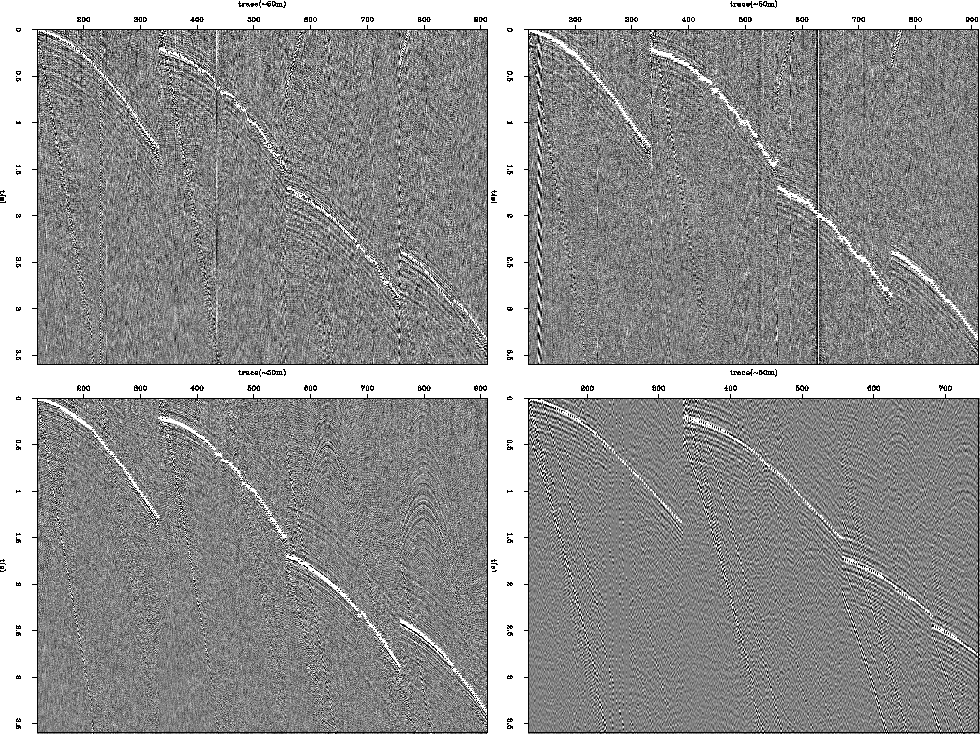
Figure ![[*]](http://sepwww.stanford.edu/latex2html/cross_ref_motif.gif) shows the same correlated gathers as
Figure
shows the same correlated gathers as
Figure ![[*]](http://sepwww.stanford.edu/latex2html/cross_ref_motif.gif) . Superimposed on the data are time picks that were
auto-picked by amplitude. The picks are not very accurate due to the
effort required to maintain stability. These picks, and the receiver
locations, are the data used to invert for the source location that
caused these events. The forward model used for the inversion was
the kinematics of a reflection from an arbitrary plane. Inversions
for a direct arrival from depth were not successful.
. Superimposed on the data are time picks that were
auto-picked by amplitude. The picks are not very accurate due to the
effort required to maintain stability. These picks, and the receiver
locations, are the data used to invert for the source location that
caused these events. The forward model used for the inversion was
the kinematics of a reflection from an arbitrary plane. Inversions
for a direct arrival from depth were not successful.
 |
The equation describing the travel-time of a planar reflection in shot-receiver coordinates is
| |
(4) |
The panels in Figure ![[*]](http://sepwww.stanford.edu/latex2html/cross_ref_motif.gif) show the effectiveness and quality
of the inversion results. The genetic algorithm uses a
random seed number that determines the characteristics of the first
population as well as how the future generations change. Fifteen seeds
were used to find the source location and medium
velocity for all four data sections. Figure
show the effectiveness and quality
of the inversion results. The genetic algorithm uses a
random seed number that determines the characteristics of the first
population as well as how the future generations change. Fifteen seeds
were used to find the source location and medium
velocity for all four data sections. Figure ![[*]](http://sepwww.stanford.edu/latex2html/cross_ref_motif.gif) is a
representative sample of the four inversion results. The panels in
the figure show the convergence of the
algorithm in total (panel 1), and the convergence of the model
parameters: velocity, distance East, and distance North
respectively. In each case the vertical axis is the fitness value that
the inversion is minimizing. The relative width of the data cloud at
the minimum fitness value for the 3 model parameters shown reflects
the precision of the inversion for this data. Velocity and
distance North are very well constrained, but distance East has a wide
region of minimum energy. Not shown are similar plots for the model
parameters associated with the planar reflection: depth, dip, and
azimuth. These parameters were completely in the null space of the
inversion.
is a
representative sample of the four inversion results. The panels in
the figure show the convergence of the
algorithm in total (panel 1), and the convergence of the model
parameters: velocity, distance East, and distance North
respectively. In each case the vertical axis is the fitness value that
the inversion is minimizing. The relative width of the data cloud at
the minimum fitness value for the 3 model parameters shown reflects
the precision of the inversion for this data. Velocity and
distance North are very well constrained, but distance East has a wide
region of minimum energy. Not shown are similar plots for the model
parameters associated with the planar reflection: depth, dip, and
azimuth. These parameters were completely in the null space of the
inversion.
|
inv
Figure 13 Residual energy of the inversion to locate the source of the energy causing the event in Figure ![[*]](http://sepwww.stanford.edu/latex2html/cross_ref_motif.gif) . As the inversion iterates, overall residual
energy decreases, and the standard deviation of the model parameters
diminishes for well constrained members. . As the inversion iterates, overall residual
energy decreases, and the standard deviation of the model parameters
diminishes for well constrained members.
| 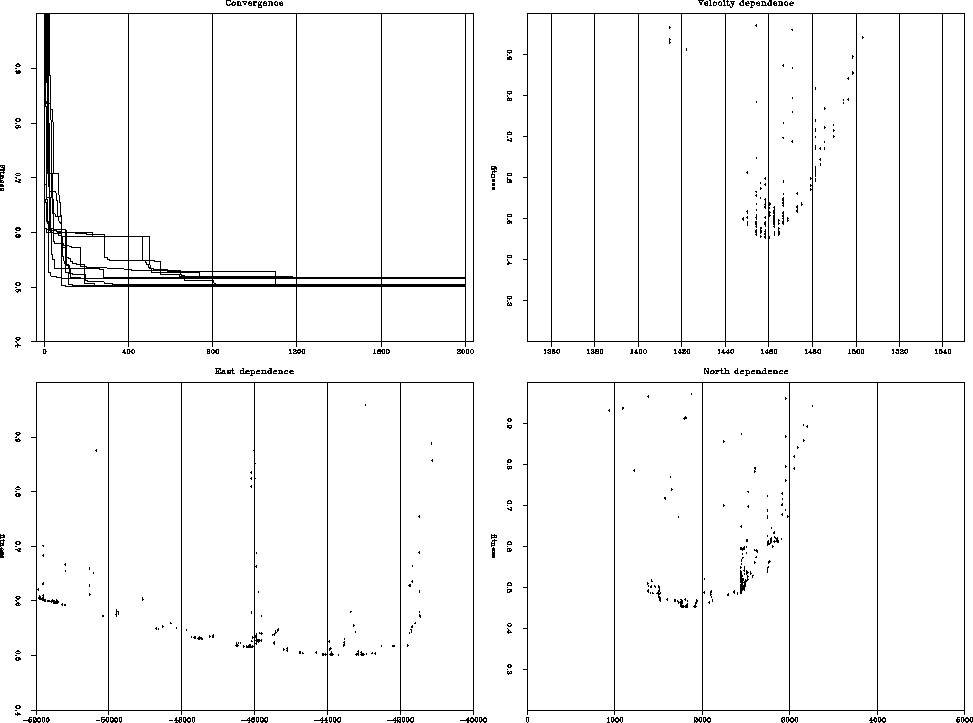 |
Figure ![[*]](http://sepwww.stanford.edu/latex2html/cross_ref_motif.gif) shows the forward modeled time picks from the
inversions. The best model parameters from all 15 inversions were
forward modeled and plotted. The points are very precise in picking
even minor deviations from regularity in the array geometry and are
much better at describing the event than the auto-picks in
Figure
shows the forward modeled time picks from the
inversions. The best model parameters from all 15 inversions were
forward modeled and plotted. The points are very precise in picking
even minor deviations from regularity in the array geometry and are
much better at describing the event than the auto-picks in
Figure ![[*]](http://sepwww.stanford.edu/latex2html/cross_ref_motif.gif) . The quality difference between the picks that
went into the inversion and the result account for the residual energy
in the first panel of Figure
. The quality difference between the picks that
went into the inversion and the result account for the residual energy
in the first panel of Figure ![[*]](http://sepwww.stanford.edu/latex2html/cross_ref_motif.gif) . The inversion was not
able to match the bad data because it was required to honor
the laws of physics. Therefore, the result is not able to converge to
zero.
. The inversion was not
able to match the bad data because it was required to honor
the laws of physics. Therefore, the result is not able to converge to
zero.
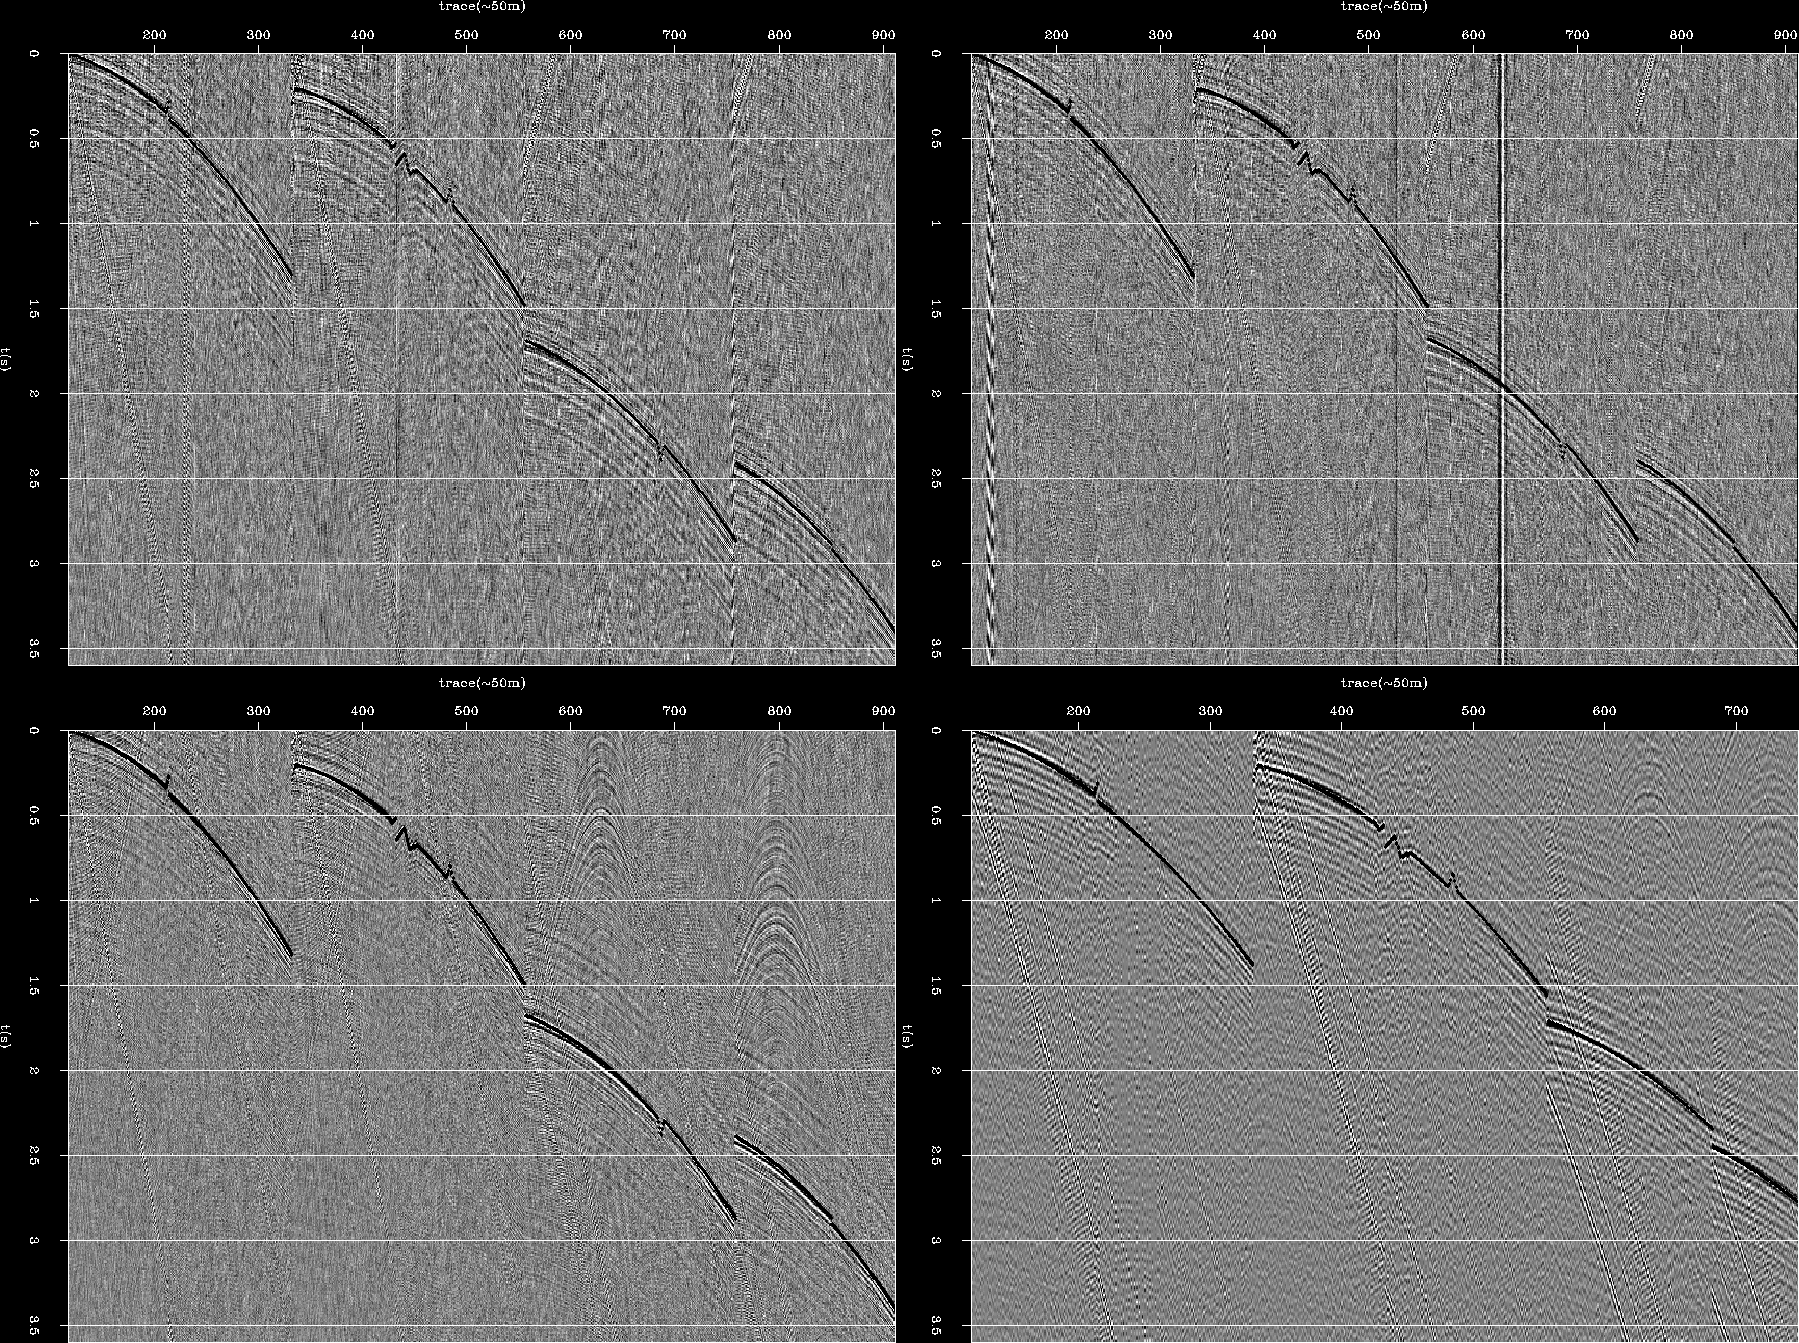 |
![[*]](http://sepwww.stanford.edu/latex2html/cross_ref_motif.gif) . The accuracy of the times is very faithful
to the irregularities in the array layout in contrast to the
auto-picked data input to the inversion, Figure
. The accuracy of the times is very faithful
to the irregularities in the array layout in contrast to the
auto-picked data input to the inversion, Figure ![[*]](http://sepwww.stanford.edu/latex2html/cross_ref_motif.gif) .
.
Using graphs such as those shown in Figure ![[*]](http://sepwww.stanford.edu/latex2html/cross_ref_motif.gif) , values for
map coordinates and velocity were selected at the location of the
minimum from all 15 inversions. The best velocity for the three data
sets from 2004 was 1460 m/s, and 1440 m/s for the data from 2005 which
are appropriate for compressional waves in the water column. The
(x,y) locations measured as distance from the NW corner of the array in
kilometers were: (2.5,-44.0), (2.0,-40.0), (2.4,-43.5), (2.75,-43.5)
in the rotated local coordinate system shown in
Figure
, values for
map coordinates and velocity were selected at the location of the
minimum from all 15 inversions. The best velocity for the three data
sets from 2004 was 1460 m/s, and 1440 m/s for the data from 2005 which
are appropriate for compressional waves in the water column. The
(x,y) locations measured as distance from the NW corner of the array in
kilometers were: (2.5,-44.0), (2.0,-40.0), (2.4,-43.5), (2.75,-43.5)
in the rotated local coordinate system shown in
Figure ![[*]](http://sepwww.stanford.edu/latex2html/cross_ref_motif.gif) . Because the inversion returned very reliable
water velocities in all cases, the lack of sensitivity for the
subsurface parameters is mitigated. If the event must be in the
water column, the sea surface and floor are the only potential
reflectors. Since the receivers are on the sea floor, the most simple
explanation of these results is that the source is also at the sea
floor and reflects from the sea surface once before arriving at the
array. However, at such large horizontal offset, and shallow water
column, the forward model cannot distinguish between this model and
the direct arrival from the surface to the sea floor. Conversely, the
source could be at the array, travel roughly horizontally, and reflect
back from a nearly vertical object. The latter situation is not
plausible, nor is the direct arrival associated with this model
recorded by the array.
. Because the inversion returned very reliable
water velocities in all cases, the lack of sensitivity for the
subsurface parameters is mitigated. If the event must be in the
water column, the sea surface and floor are the only potential
reflectors. Since the receivers are on the sea floor, the most simple
explanation of these results is that the source is also at the sea
floor and reflects from the sea surface once before arriving at the
array. However, at such large horizontal offset, and shallow water
column, the forward model cannot distinguish between this model and
the direct arrival from the surface to the sea floor. Conversely, the
source could be at the array, travel roughly horizontally, and reflect
back from a nearly vertical object. The latter situation is not
plausible, nor is the direct arrival associated with this model
recorded by the array.
Using the values listed above, time picks at every receiver station
were forward modeled for use as data in an exhaustive search
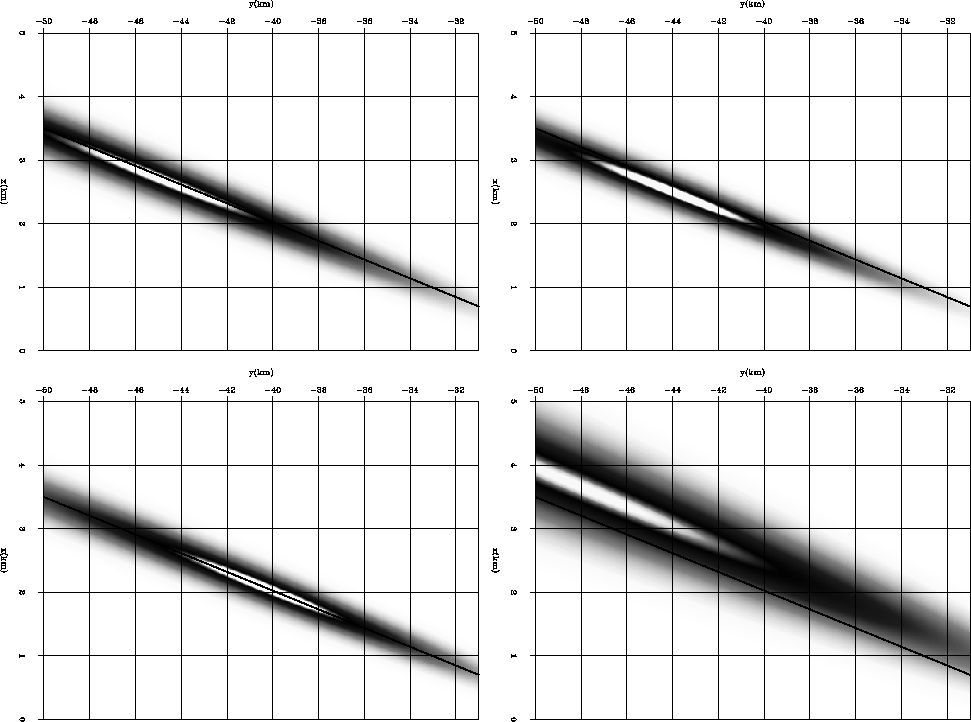
inversion. The gray scale in Figure ![[*]](http://sepwww.stanford.edu/latex2html/cross_ref_motif.gif) shows the inverse of
the data misfit normalized by the maximum value. The velocities used
were those stated above. The same line is plotted on the panels for
reference (8o from the horizontal axis). All data volumes resolve
the source location at very similar locations with almost identical
trends in precision. A request to the Norwegian Petroleum Directorate
indicates that there were no active seismic vessels acquiring data in
this region on or around February 15, 2004. The similar location
derived from the data collected in 2005 indicates that surface seismic
acquisition is likely not the cause of this feature.
shows the inverse of
the data misfit normalized by the maximum value. The velocities used
were those stated above. The same line is plotted on the panels for
reference (8o from the horizontal axis). All data volumes resolve
the source location at very similar locations with almost identical
trends in precision. A request to the Norwegian Petroleum Directorate
indicates that there were no active seismic vessels acquiring data in
this region on or around February 15, 2004. The similar location
derived from the data collected in 2005 indicates that surface seismic
acquisition is likely not the cause of this feature.
 |
The geometric construct used to calculate the kinematics of a
reflection from a flat plane is to double the time from the source to
the midpoint on the plane. It is also possible that the source
location was twice the distance away and the event is a multiple along
the same azimuth. Another possible ray path which shares the
kinematics of the forward modeling operator is one with three ray
paths through the water column. This event begins at the surface, is
reflected up from the sea floor, and then once more from the surface
to be recorded by the OBC sensors. This travel path is at most 2/3 of
the distance from the array along the same azimuth. Similarly, any
odd number of raypaths, k, through the water column will move the source
toward the array by 2/k. Therefore, it is plausible to move the
source location from the inversion almost anywhere along the azimuth of the
lines plotted in Figure ![[*]](http://sepwww.stanford.edu/latex2html/cross_ref_motif.gif) .
.
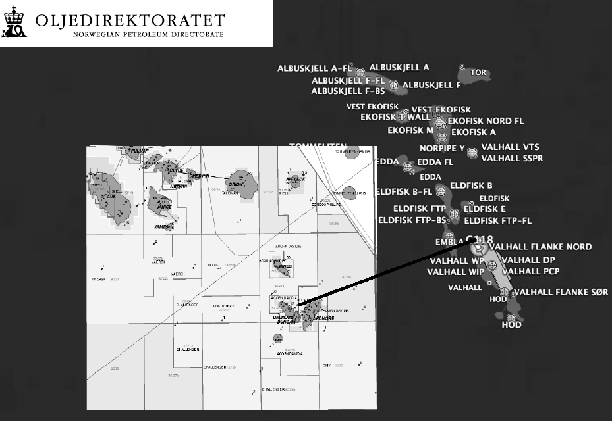
Figure ![[*]](http://sepwww.stanford.edu/latex2html/cross_ref_motif.gif) is a detailed map of the Norwegian and British
oil infrastructure around the Valhall reservoir. Also plotted are the
footprint of the receiver array, and the location of the trace used as
source function (G118) for the gathers presented above. Superimposed
as a flat image (and thereby introducing small projection errors) is a
map of the British production facilities in the area. The black line
from the receiver array ends in the SW at the locus of the energy
provided by the inversions described above. The location of the
source for the events in Figure
is a detailed map of the Norwegian and British
oil infrastructure around the Valhall reservoir. Also plotted are the
footprint of the receiver array, and the location of the trace used as
source function (G118) for the gathers presented above. Superimposed
as a flat image (and thereby introducing small projection errors) is a
map of the British production facilities in the area. The black line
from the receiver array ends in the SW at the locus of the energy
provided by the inversions described above. The location of the
source for the events in Figure ![[*]](http://sepwww.stanford.edu/latex2html/cross_ref_motif.gif) is exactly over the
Ardmore field in British controlled section of the North Sea.
is exactly over the
Ardmore field in British controlled section of the North Sea.
|
mapa
Figure 16 A small section of the British infrastructure map with the Norwegian infrastructure and the location of the energy source inverted in Figure ![[*]](http://sepwww.stanford.edu/latex2html/cross_ref_motif.gif) . The
inverted locus of the energy in the gathers (the SW terminus of the
black line) corresponds exactly to the location of the
Ardmore development. . The
inverted locus of the energy in the gathers (the SW terminus of the
black line) corresponds exactly to the location of the
Ardmore development.
|  |