

Next: Mathematical basis of Pyramid
Up: Gaussian Pyramid Generation
Previous: Gaussian pyramid generation
An approximate reverse of the process of generating a pyramid structure is termed as pyramid expansion. The main function of the expansion algorithm is to enhance a pyramid level of size M+1 by N+1 to size 2M+1 by 2N+1 by interpolating new sample values between those at the current level. Thus the expansion process applied l times to an image at pyramid level j would yield an image  which is of the same size as an image at the pyramid level j-l that is
  . Formally the expansion operation can be defined as:
|  |
(5) |
shot2eg
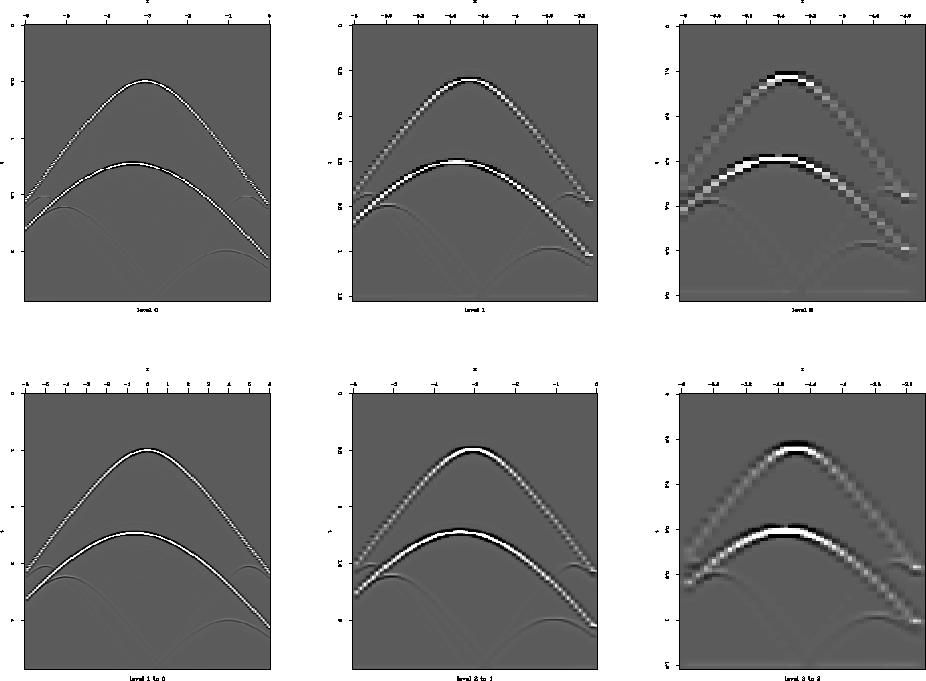
Figure 1 Three levels of the Gaussian pyramid formation (top panel) and expansion (bottom panel).In the bottom panel each level is expanded to the next lower level.


 seisw
seisw
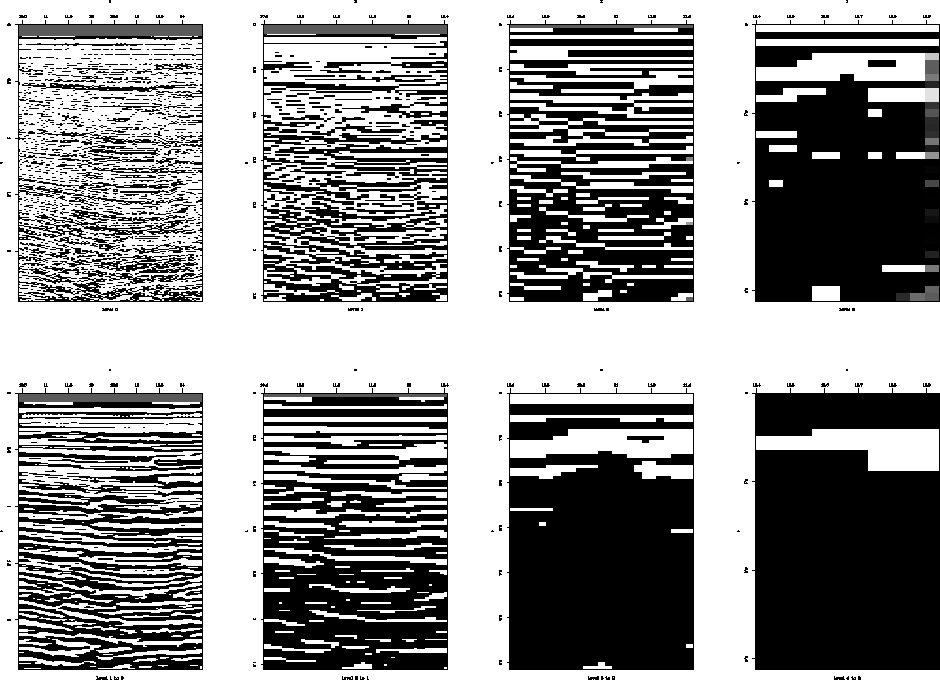
Figure 2 Four levels of the Gaussian pyramid formation (top panel) and expansion (bottom panel).In the bottom panel each level is expanded to the next lower level.


 stlinesz
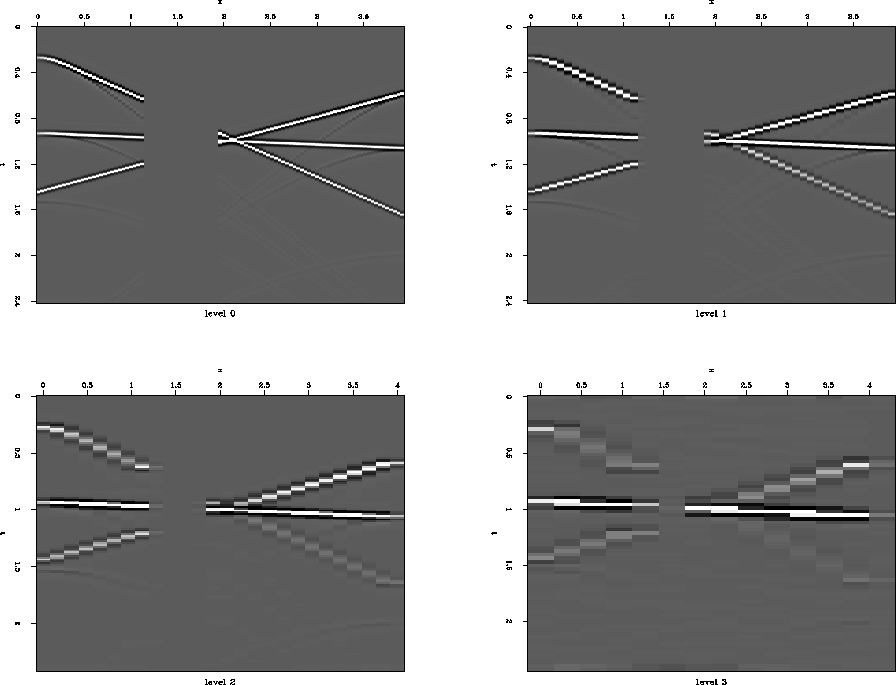
Figure 3 Four levels of the Gaussian pyramid formation for data with holes.


 stlinesf
Figure 4 Filling up the holes at each level of the pyramid starting from the topmost pyramid level (upper left).


Notice that during the sum only values for which the indices are integer are included as contribution to the next higher level. A simple example consisting of two shot gathers is used to demonstrate the pyramid generation and expansion operation in Figure ![[*]](http://sepwww.stanford.edu/latex2html/cross_ref_motif.gif) . The top panel of the figure shows three levels of the pyramid while the bottom panel shows the process of expansion from one level to the next. The next example (Figure
. The top panel of the figure shows three levels of the pyramid while the bottom panel shows the process of expansion from one level to the next. The next example (Figure ![[*]](http://sepwww.stanford.edu/latex2html/cross_ref_motif.gif) ) consists of a stacked seismic. Again the top panel of the figure shows the levels of the Gaussian pyramid while the bottom panel shows the expansion.
Each of the images in the top panels of Figures
) consists of a stacked seismic. Again the top panel of the figure shows the levels of the Gaussian pyramid while the bottom panel shows the expansion.
Each of the images in the top panels of Figures ![[*]](http://sepwww.stanford.edu/latex2html/cross_ref_motif.gif) and
and ![[*]](http://sepwww.stanford.edu/latex2html/cross_ref_motif.gif) have been obtained by applying the same 5-by-5 weighting function. Notice that as the pyramid levels stack up the sample density along each of the two axes reduces by a factor of 2. During the expansion process (bottom panels of figures
have been obtained by applying the same 5-by-5 weighting function. Notice that as the pyramid levels stack up the sample density along each of the two axes reduces by a factor of 2. During the expansion process (bottom panels of figures ![[*]](http://sepwww.stanford.edu/latex2html/cross_ref_motif.gif) and
and ![[*]](http://sepwww.stanford.edu/latex2html/cross_ref_motif.gif) ) on the other hand the number of sample point increase by a factor of 2 along each axis.
) on the other hand the number of sample point increase by a factor of 2 along each axis.


Next: Mathematical basis of Pyramid
Up: Gaussian Pyramid Generation
Previous: Gaussian pyramid generation
Stanford Exploration Project
4/5/2006


![[*]](http://sepwww.stanford.edu/latex2html/cross_ref_motif.gif) . The top panel of the figure shows three levels of the pyramid while the bottom panel shows the process of expansion from one level to the next. The next example (Figure
. The top panel of the figure shows three levels of the pyramid while the bottom panel shows the process of expansion from one level to the next. The next example (Figure ![[*]](http://sepwww.stanford.edu/latex2html/cross_ref_motif.gif) ) consists of a stacked seismic. Again the top panel of the figure shows the levels of the Gaussian pyramid while the bottom panel shows the expansion.
Each of the images in the top panels of Figures
) consists of a stacked seismic. Again the top panel of the figure shows the levels of the Gaussian pyramid while the bottom panel shows the expansion.
Each of the images in the top panels of Figures ![[*]](http://sepwww.stanford.edu/latex2html/cross_ref_motif.gif) and
and ![[*]](http://sepwww.stanford.edu/latex2html/cross_ref_motif.gif) have been obtained by applying the same 5-by-5 weighting function. Notice that as the pyramid levels stack up the sample density along each of the two axes reduces by a factor of 2. During the expansion process (bottom panels of figures
have been obtained by applying the same 5-by-5 weighting function. Notice that as the pyramid levels stack up the sample density along each of the two axes reduces by a factor of 2. During the expansion process (bottom panels of figures ![[*]](http://sepwww.stanford.edu/latex2html/cross_ref_motif.gif) and
and ![[*]](http://sepwww.stanford.edu/latex2html/cross_ref_motif.gif) ) on the other hand the number of sample point increase by a factor of 2 along each axis.
) on the other hand the number of sample point increase by a factor of 2 along each axis.