 |
Figure 4 The image of the left salt body in Cartesian coordinates.
![[*]](http://sepwww.stanford.edu/latex2html/cross_ref_motif.gif) shows the velocity model of the dataset.
One of the challenges for velocity analysis of this dataset is the delineation of the two salt bodies.
The left one is a complex, multi-valued salt body with a greatly rugose top.
Some parts of its top and flank and the sediments inside the salt are steeply dipping.
These features are not easily imaged by downward continuation. The right salt body is deeply rooted, and
its roots are very steep. Waves reflected at the center part of the two roots overturn and travel through
the complex salt body to the left. Downward continuation loses the energy and cannot connect these two roots.
Even with the true velocity, it is still challenging to image the complex salt bodies.
shows the velocity model of the dataset.
One of the challenges for velocity analysis of this dataset is the delineation of the two salt bodies.
The left one is a complex, multi-valued salt body with a greatly rugose top.
Some parts of its top and flank and the sediments inside the salt are steeply dipping.
These features are not easily imaged by downward continuation. The right salt body is deeply rooted, and
its roots are very steep. Waves reflected at the center part of the two roots overturn and travel through
the complex salt body to the left. Downward continuation loses the energy and cannot connect these two roots.
Even with the true velocity, it is still challenging to image the complex salt bodies.
 |
 |
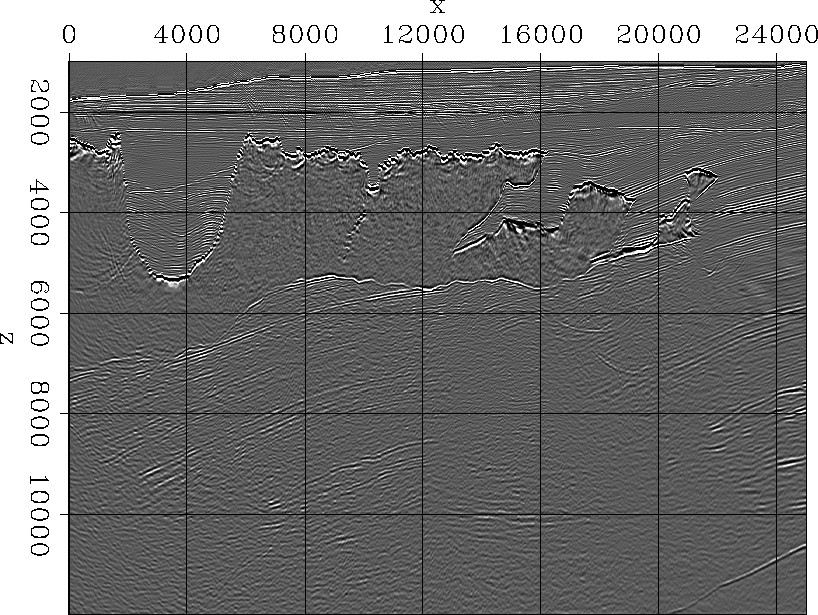
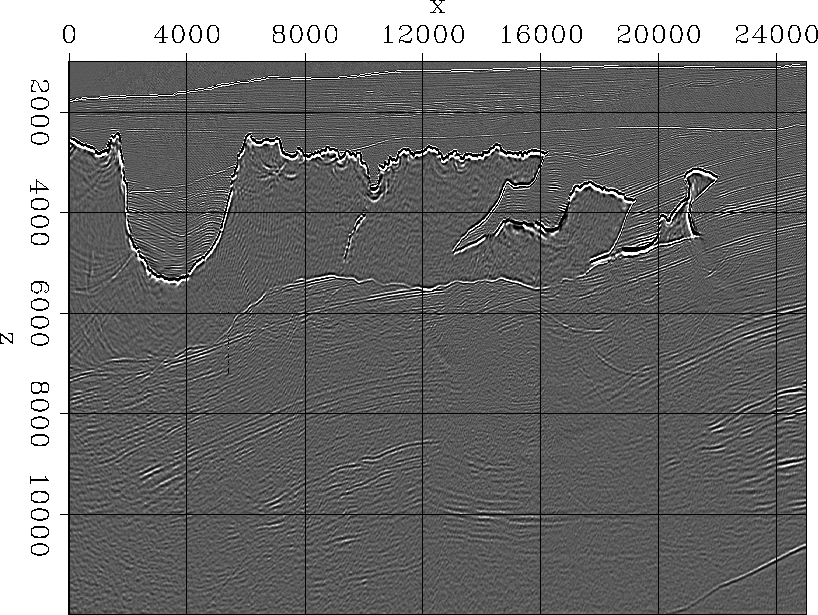
We run plane-wave migration in both Cartesian and tilted coordinates. We generate 200 plane-wave sources in total,
and the take-off angles at the surface range from ![]() to
to ![]() . Since we do not run multiple
attenuation, the images are contaminated by the multiples.
. Since we do not run multiple
attenuation, the images are contaminated by the multiples.
Figure ![[*]](http://sepwww.stanford.edu/latex2html/cross_ref_motif.gif) shows the velocity model of the left rugose salt body.
Figures
shows the velocity model of the left rugose salt body.
Figures ![[*]](http://sepwww.stanford.edu/latex2html/cross_ref_motif.gif) and
and ![[*]](http://sepwww.stanford.edu/latex2html/cross_ref_motif.gif) show the images.
Figure
show the images.
Figure ![[*]](http://sepwww.stanford.edu/latex2html/cross_ref_motif.gif) is obtained by downward continuation,
and Figure
is obtained by downward continuation,
and Figure ![[*]](http://sepwww.stanford.edu/latex2html/cross_ref_motif.gif) is obtained by plane-wave migration in tilted coordinates.
In Figure
is obtained by plane-wave migration in tilted coordinates.
In Figure ![[*]](http://sepwww.stanford.edu/latex2html/cross_ref_motif.gif) , the image of the
top of the salt is not continuous. Some parts of the top are almost vertical and are lost in the downward
continuation. This image captures only the bottom of the two canyons, and loses their flanks.
Downward continuation also loses the steep salt flanks in the multi-valued area. These losses make picking
the salt difficult. In contrast, plane-wave migration in tilted coordinates images the salt body
very well and makes salt picking easier.
, the image of the
top of the salt is not continuous. Some parts of the top are almost vertical and are lost in the downward
continuation. This image captures only the bottom of the two canyons, and loses their flanks.
Downward continuation also loses the steep salt flanks in the multi-valued area. These losses make picking
the salt difficult. In contrast, plane-wave migration in tilted coordinates images the salt body
very well and makes salt picking easier.
 |
Figure ![[*]](http://sepwww.stanford.edu/latex2html/cross_ref_motif.gif) shows the velocity model of the right salt body.
Figures
shows the velocity model of the right salt body.
Figures ![[*]](http://sepwww.stanford.edu/latex2html/cross_ref_motif.gif) and
and ![[*]](http://sepwww.stanford.edu/latex2html/cross_ref_motif.gif) show the images.
Figure
show the images.
Figure ![[*]](http://sepwww.stanford.edu/latex2html/cross_ref_motif.gif) is obtained by downward continuation, and
Figure
is obtained by downward continuation, and
Figure ![[*]](http://sepwww.stanford.edu/latex2html/cross_ref_motif.gif) is obtained by plane-wave migration in tilted coordinates. Downward continuation loses the flanks
of the top part of the salt. Due to overturned waves, downward continuation also loses the right leg and the center
part of the left leg. In contrast, plane-wave migration images most parts of the salt flanks and the two legs.
Hence, it is much easier to interpret the salt body from Figure
is obtained by plane-wave migration in tilted coordinates. Downward continuation loses the flanks
of the top part of the salt. Due to overturned waves, downward continuation also loses the right leg and the center
part of the left leg. In contrast, plane-wave migration images most parts of the salt flanks and the two legs.
Hence, it is much easier to interpret the salt body from Figure ![[*]](http://sepwww.stanford.edu/latex2html/cross_ref_motif.gif) .
.