

Next: Conclusions
Up: Rosales et al.: PS-ADCIG
Previous: Synthetic Examples
This test uses a portion of the 2-D real data set
from the Mahogany field, located in the Gulf of Mexico.
The 2-D data set is an Ocean Bottom Seismic (OBS)
multicomponent line. The data has been already
preprocessed. The hydrophone and the vertical components
of the geophone has been combined to form the PZ section.
Also, the data has also been separated into the PS section.
We concentrate on the PZ section and the PS section.
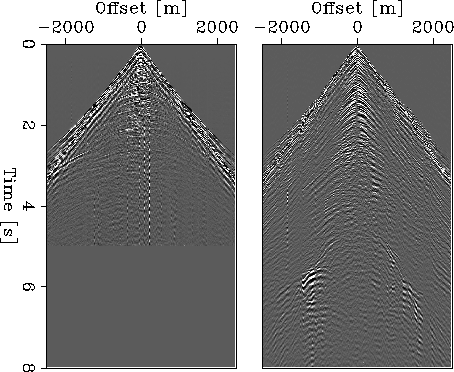
Figure ![[*]](http://sepwww.stanford.edu/latex2html/cross_ref_motif.gif) presents a typical
shot gather for this OBS data set. On the left
we have the PZ common-shot gather, and on the right
we have the PS common-shot gather. The PZ shot gather
has fewer time samples than the PS shot gather because
of the longer time needed to observe the converted-wave
events. Also, note the polarity flip in the
PS common-shot gather, a typical characteristic of
this type of data set.
presents a typical
shot gather for this OBS data set. On the left
we have the PZ common-shot gather, and on the right
we have the PS common-shot gather. The PZ shot gather
has fewer time samples than the PS shot gather because
of the longer time needed to observe the converted-wave
events. Also, note the polarity flip in the
PS common-shot gather, a typical characteristic of
this type of data set.
shots
Figure 5 Typical
common-shot gathers for the OBS Mahogany data set from
the Gulf of Mexico. Shot gather after PZ summation (a),
PS shot gather (b).


In both data sets, the PZ and the PS components were migrated
using wave-equation shot-profile migration.
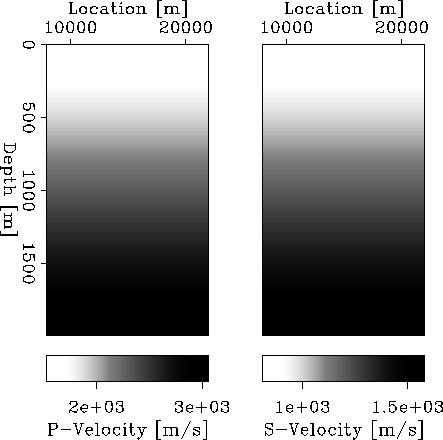
Both, the P and the S
velocity models are unknown for this problem; for simplicity,
migrate using a velocity model with a linear gradient,
Figure ![[*]](http://sepwww.stanford.edu/latex2html/cross_ref_motif.gif) shows both velocity models,
the P-velocity model on the left panel, and the S-velocity model in
the right panel. Complementary, Figure
shows both velocity models,
the P-velocity model on the left panel, and the S-velocity model in
the right panel. Complementary, Figure ![[*]](http://sepwww.stanford.edu/latex2html/cross_ref_motif.gif) represents
the local step-out field for this experiment.
represents
the local step-out field for this experiment.
vels
Figure 6 Velocity models
used for the shot-gather migration. P-velocity on the left panel,
S-velocity on the right panel.
|
|  |


dips
Figure 7 Local step-out
of the image; this represents the field  on
equation 4. on
equation 4.
|
| 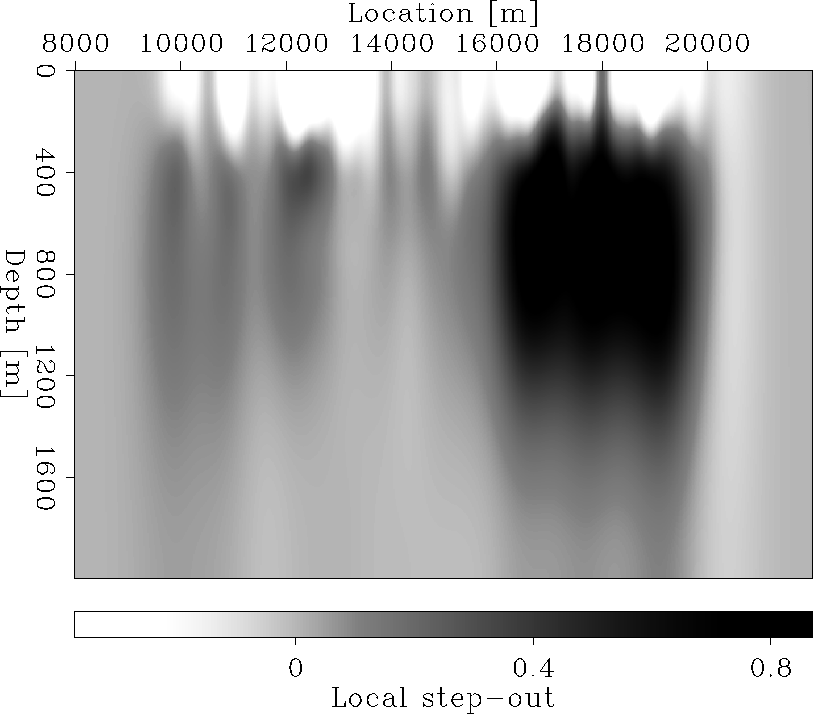 |


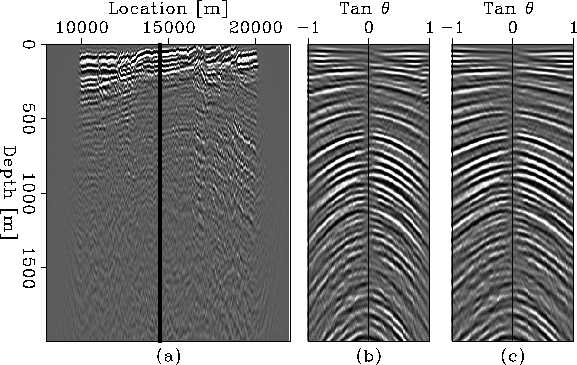
Figure ![[*]](http://sepwww.stanford.edu/latex2html/cross_ref_motif.gif) presents a PS image on the left,
and two angle-domain common-image gathers on the right. Both
common-image gathers are taken at the same location,
indicated by the solid line at CIG=14500 in the image.
The PS image was taken at zero subsurface offset, this is
not the ideal position to take the final image, since
the polarity flip destroys the image at this location. The
ideal case will be flip the polarities in the angle domain
Rosales and Rickett (2001); unfortunately, we do not have the
correct velocity model yet; therefore, we have only an approximate
solution to the final PS image.
presents a PS image on the left,
and two angle-domain common-image gathers on the right. Both
common-image gathers are taken at the same location,
indicated by the solid line at CIG=14500 in the image.
The PS image was taken at zero subsurface offset, this is
not the ideal position to take the final image, since
the polarity flip destroys the image at this location. The
ideal case will be flip the polarities in the angle domain
Rosales and Rickett (2001); unfortunately, we do not have the
correct velocity model yet; therefore, we have only an approximate
solution to the final PS image.
The angle-domain common-image gather on panel
(b) of Figure ![[*]](http://sepwww.stanford.edu/latex2html/cross_ref_motif.gif) represents the angle-domain
common-image gathers using the conventional methodology, which
will be
represents the angle-domain
common-image gathers using the conventional methodology, which
will be  on the diagram flow on Figure
 ![[*]](http://sepwww.stanford.edu/latex2html/cross_ref_motif.gif) .
The angle-domain common-image gather on panel (c), represents
the true converted-wave angle-domain common-image gather.
The transformation to the angle-domain was performed with the
diagram flow on Figure
.
The angle-domain common-image gather on panel (c), represents
the true converted-wave angle-domain common-image gather.
The transformation to the angle-domain was performed with the
diagram flow on Figure ![[*]](http://sepwww.stanford.edu/latex2html/cross_ref_motif.gif) .
.
The geology for this section of the Mahogany data set consists of
very low geological dips, with a relatively layering; therefore, the
angle gather on panel (b) has the polarity flip very close
to zero angle. The true angle gather also preserves this
characteristic. The residual curvature for the events,
whether primaries or multiples, is much larger than the
residual curvature of the same events in the true angle-domain common-image gather.
This effect is due to the correction for both the
step-out of the image and the P-to-S velocity ratio, as
presented in the theory section of this paper.
psimg-adcig
Figure 8
PS image on the left,
and two angle-domain common-image gathers on the right; both
common-image gathers are taken at the same location, as
represented by the solid line at CIG=14500 in the image.


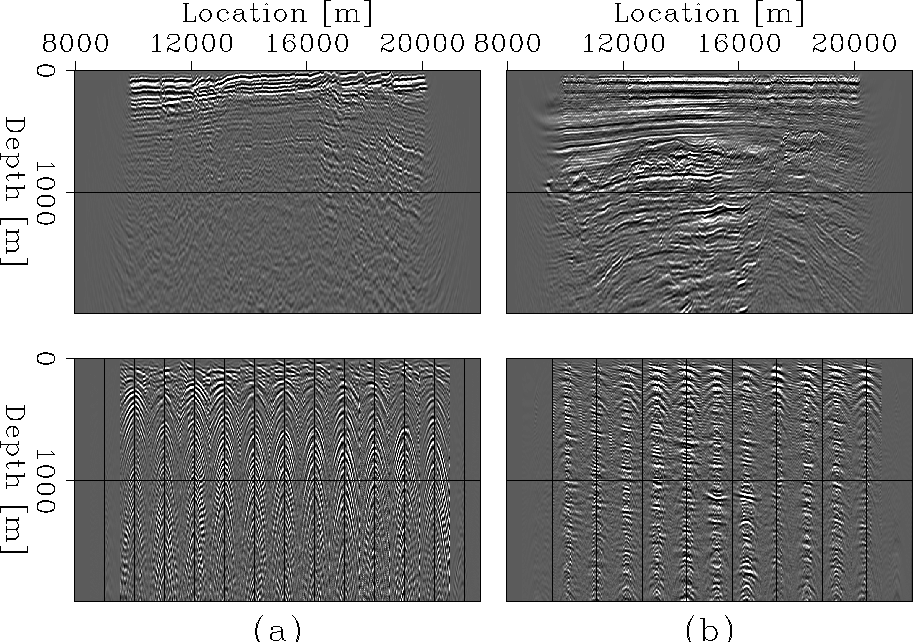
Figure ![[*]](http://sepwww.stanford.edu/latex2html/cross_ref_motif.gif) presents the PS and the PZ
results of shot-profile migration with the velocity
models on Figure
presents the PS and the PZ
results of shot-profile migration with the velocity
models on Figure ![[*]](http://sepwww.stanford.edu/latex2html/cross_ref_motif.gif) . Panel (a) presents the
PS image on the top and its corresponding angle-domain
common-image gathers on the bottom. Panel (b) presents
the PZ image on the top and its corresponding angle-domain
common-image gathers on the bottom. In both representations
of the angle gathers, it is possible to observe events
at a very similar depth, these events probably represent
the same geological feature. Also notice the many
multiples, due to the shallow sea bottom (120 m).
These multiples are more prominent in the PS section because
the PZ summation already eliminates the source ghost. This
is not the case for the PS section.
. Panel (a) presents the
PS image on the top and its corresponding angle-domain
common-image gathers on the bottom. Panel (b) presents
the PZ image on the top and its corresponding angle-domain
common-image gathers on the bottom. In both representations
of the angle gathers, it is possible to observe events
at a very similar depth, these events probably represent
the same geological feature. Also notice the many
multiples, due to the shallow sea bottom (120 m).
These multiples are more prominent in the PS section because
the PZ summation already eliminates the source ghost. This
is not the case for the PS section.
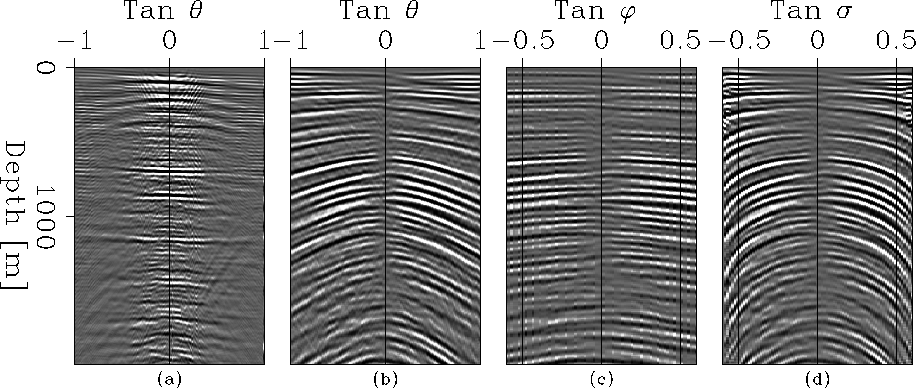
Figure ![[*]](http://sepwww.stanford.edu/latex2html/cross_ref_motif.gif) compiles all the different
angle-domain common-image gathers for this data set,
all of which are taken at the same position,
CIG=14500. From left to right, the panels show PP-ADCIG, PS-ADCIG,
P-ADCIG, and S-ADCIG. Notice that most of the primary
events have a residual curvature. The residual moveout
is more prominent for those events that we identify
as multiples.
compiles all the different
angle-domain common-image gathers for this data set,
all of which are taken at the same position,
CIG=14500. From left to right, the panels show PP-ADCIG, PS-ADCIG,
P-ADCIG, and S-ADCIG. Notice that most of the primary
events have a residual curvature. The residual moveout
is more prominent for those events that we identify
as multiples.
imag-cigs
Figure 9 Panel (a)
presents the PS image with its respective angle-domain
common-image gathers. Panel (b) presents the PZ image
with its respective angle-domain common-image gathers.


 cigs-all
Figure 10 Compilation of angle-domain
common-image gather for the 2-D Mahogany data set, all the
CIGs are taken at the same image location (CIG=14500).
(a) PP-ADCIG, (b) PS-ADCIG, (c) P-ADCIG, (d) S-ADCIG.


The initial linear P-velocity model is a pretty good
approximation, since most of the primary events
in the PZ section are flat in the angle-domain.
However, there is a prominent residual curvature in the
angle-domain common-image gathers for the PS section.
This indicates an erroneous velocity model, most likely
a very high initial S-velocity model. Moreover, the
S section contains a large number of multiples, which
are not all present in the PZ section.
The individuals P-ADCIG and the S-ADCIG contain
information that potentially can be used for
independent velocity updates. Notice
that the angle coverage for these gathers
is smaller than for the PP- and-PS ADCIGs, since
the coverage of an individual plane-wave is smaller
than the combination of two plane-waves, as
is the case for converted-mode data.
It is very interesting to notice that the
individual P-ADCIG has very similar characteristics
with the PP-ADCIG. Most of the
residual moveout of the PS-ADCIG seems to be
due to the S component of the velocity model,
as suggested for the individual S-ADCIG.


Next: Conclusions
Up: Rosales et al.: PS-ADCIG
Previous: Synthetic Examples
Stanford Exploration Project
4/5/2006
![[*]](http://sepwww.stanford.edu/latex2html/cross_ref_motif.gif) presents a typical
shot gather for this OBS data set. On the left
we have the PZ common-shot gather, and on the right
we have the PS common-shot gather. The PZ shot gather
has fewer time samples than the PS shot gather because
of the longer time needed to observe the converted-wave
events. Also, note the polarity flip in the
PS common-shot gather, a typical characteristic of
this type of data set.
presents a typical
shot gather for this OBS data set. On the left
we have the PZ common-shot gather, and on the right
we have the PS common-shot gather. The PZ shot gather
has fewer time samples than the PS shot gather because
of the longer time needed to observe the converted-wave
events. Also, note the polarity flip in the
PS common-shot gather, a typical characteristic of
this type of data set.
