|
cube
Figure 1 The top panel is the `stack' approach, the center is the `reference' approach, and the bottom panel is the `inverse' approach. | 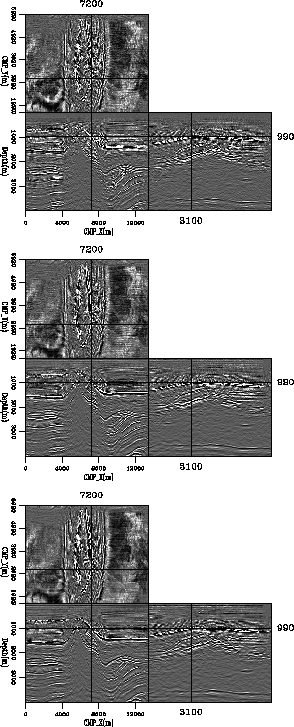 |
![[*]](http://sepwww.stanford.edu/latex2html/movie.gif)
![[*]](http://sepwww.stanford.edu/latex2html/cross_ref_motif.gif) shows all three result. The top panel
is the `stack' approach, the center is the `reference' approach,
and the bottom panel is the `inverse' approach.
All the remaining figures will be of the same form.
shows all three result. The top panel
is the `stack' approach, the center is the `reference' approach,
and the bottom panel is the `inverse' approach.
All the remaining figures will be of the same form.
|
cube
Figure 1 The top panel is the `stack' approach, the center is the `reference' approach, and the bottom panel is the `inverse' approach. |  |
![[*]](http://sepwww.stanford.edu/latex2html/movie.gif)
Figure ![[*]](http://sepwww.stanford.edu/latex2html/cross_ref_motif.gif) compares a depth slice at 900 m.
Note at `A' what looks like noise on the `stack' and `reference' result,
turns into a fault on the `inverse' result
At `B' we see a steeply dipping reflector come into focus
when we apply the `reference' approach. The acquisition footprint
visible at `C' diminishes with the `reference' approach, and is
almost completely absent in the `inverse' result.
At a depth of 1360 m (Figure
compares a depth slice at 900 m.
Note at `A' what looks like noise on the `stack' and `reference' result,
turns into a fault on the `inverse' result
At `B' we see a steeply dipping reflector come into focus
when we apply the `reference' approach. The acquisition footprint
visible at `C' diminishes with the `reference' approach, and is
almost completely absent in the `inverse' result.
At a depth of 1360 m (Figure ![[*]](http://sepwww.stanford.edu/latex2html/cross_ref_motif.gif) ) we can see similar improvements.
At `A' we see fault reflection that is not visible on
the `stack' result, barely visible on the 'reference' result
become very evident on the `inverse' result.
At `B' we see significant acquisition footprint in the
`stack' result, it is reduced significant in the `reference' result,
and in the `inverse' result we begin to see additional fine
featured geology appear.
At `C' we a portion of fault in the `stack' result, continuous
segment in the `reference' result, and the entire fault reflection
in the `inverse' result.
) we can see similar improvements.
At `A' we see fault reflection that is not visible on
the `stack' result, barely visible on the 'reference' result
become very evident on the `inverse' result.
At `B' we see significant acquisition footprint in the
`stack' result, it is reduced significant in the `reference' result,
and in the `inverse' result we begin to see additional fine
featured geology appear.
At `C' we a portion of fault in the `stack' result, continuous
segment in the `reference' result, and the entire fault reflection
in the `inverse' result.
|
depth1
Figure 2 The top panel is the `stack' approach, the center is the `reference' approach, and the bottom panel is the `inverse' approach. Note at `A' what looks like noise on the `stack' and `reference' result, turns into a fault on the `inverse' result At `B' we see a steeply dipping reflector come into focus when we apply the `reference' approach. The acquisition footprint visible at `C' diminishes with the `reference' approach, and is almost completely absent in the `inverse' result. | 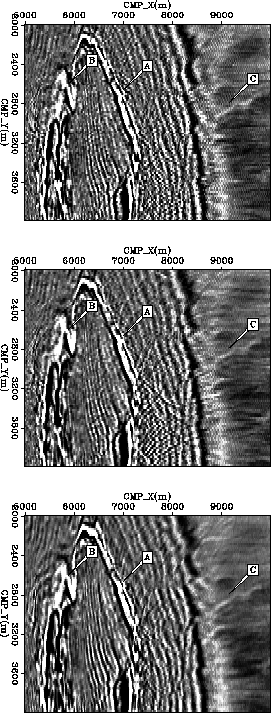 |
![[*]](http://sepwww.stanford.edu/latex2html/movie.gif)
|
depth2
Figure 3 The top panel is the `stack' approach, the center is the `reference' approach, and the bottom panel is the `inverse' approach. At `A' we see fault reflection that is not visible on the `stack' result, barely visible on the 'reference' result become very evident on the `inverse' result. At `B' we see significant acquisition footprint in the `stack' result, it is reduced significant in the `reference' result, and in the `inverse' result we begin to see additional fine featured geology appear. At `C' we a portion of fault in the `stack' result, continuous segment in the `reference' result, and the entire fault reflection in the `inverse' result. | 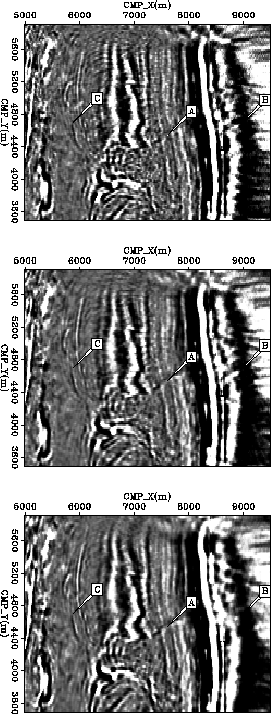 |
![[*]](http://sepwww.stanford.edu/latex2html/movie.gif)
Figure ![[*]](http://sepwww.stanford.edu/latex2html/cross_ref_motif.gif) shows a cross-line located at 7200m.
Note the fault reflection at `A' that is barely visible
in the `stack' result appear in the 'reference'
result, and become coherent in the `inverse' result.
Note the small faults at `B' that are not visible
in the `stack' or `reference' result become evident
in the `inverse' result.
Figure
shows a cross-line located at 7200m.
Note the fault reflection at `A' that is barely visible
in the `stack' result appear in the 'reference'
result, and become coherent in the `inverse' result.
Note the small faults at `B' that are not visible
in the `stack' or `reference' result become evident
in the `inverse' result.
Figure ![[*]](http://sepwww.stanford.edu/latex2html/cross_ref_motif.gif) shows a cross-line at 8200m.
Note the small faults become much more evident
as we progress from the `stack' to the `inverse' result.
At `B' we see the migration artifacts dramatically
decrease as we move from the `reference' to the `inverse'
result.
shows a cross-line at 8200m.
Note the small faults become much more evident
as we progress from the `stack' to the `inverse' result.
At `B' we see the migration artifacts dramatically
decrease as we move from the `reference' to the `inverse'
result.
|
xline1
Figure 4 The top panel is the `stack' approach, the center is the `reference' approach, and the bottom panel is the `inverse' approach. All three figures show a cross-line located at 7200m. Note the fault reflection at `A' that is barely visible in the `stack' result appear in the 'reference' result, and become coherent in the `inverse' result. Note the small faults at `B' that are not visible in the `stack' or `reference' result become evident in the `inverse' result. | 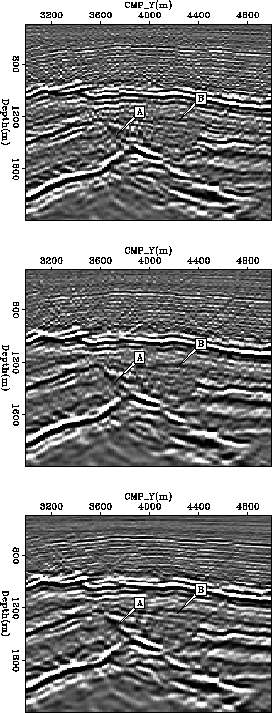 |
![[*]](http://sepwww.stanford.edu/latex2html/movie.gif)
|
xline2
Figure 5 The top panel is the `stack' approach, the center is the `reference' approach, and the bottom panel is the `inverse' approach. All three figures show a cross-line located at 7200m. Note the small faults become much more evident as we progress from the `stack' to the `inverse' result. At `B' we see the migration artifacts dramatically decrease as we move from the `reference' to the `inverse' result. | 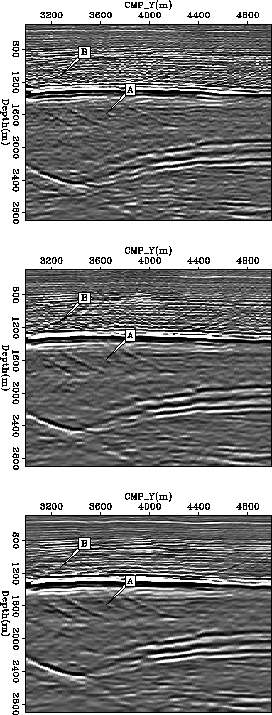 |
![[*]](http://sepwww.stanford.edu/latex2html/movie.gif)
Figure ![[*]](http://sepwww.stanford.edu/latex2html/cross_ref_motif.gif) shows an inline section at 3100m.
Note the steeply dipping reflectors that are not visible
at `A' in the `stack' result come into focus in the inverse result.
At `B' we see a peak that isn't visible in either the
`stack' or `reference' result appear in the inverse result.
At `C' we see a package of reflectors that are incoherent
in the `stack' result become clearer
as we move to the `reference' and `inverse' result.
Figure
shows an inline section at 3100m.
Note the steeply dipping reflectors that are not visible
at `A' in the `stack' result come into focus in the inverse result.
At `B' we see a peak that isn't visible in either the
`stack' or `reference' result appear in the inverse result.
At `C' we see a package of reflectors that are incoherent
in the `stack' result become clearer
as we move to the `reference' and `inverse' result.
Figure ![[*]](http://sepwww.stanford.edu/latex2html/cross_ref_motif.gif) shows an
inline section location at 3960m. At `A' the complex folding
above the salt intrusion come into focus in
the `inversion' result. The set of reflectors
above the salt come into focus as we advance
to more sophisticated techniques at `B'. At `C'
we see the salt reflection come into focus
as we move to the `reference' and `inverse' approach.
shows an
inline section location at 3960m. At `A' the complex folding
above the salt intrusion come into focus in
the `inversion' result. The set of reflectors
above the salt come into focus as we advance
to more sophisticated techniques at `B'. At `C'
we see the salt reflection come into focus
as we move to the `reference' and `inverse' approach.
|
iline1
Figure 6 The top panel is the `stack' approach, the center is the `reference' approach, and the bottom panel is the `inverse' approach. All three figures show a in-line located at 3100m. Note the steeply dipping reflectors that aren't visible at `A' in the `stack' result come into focus in the inverse result. At `B' we see a peak that isn't visible in either the `stack' or `reference' result appear in the inverse result. At `C' we see a package of reflectors that are incoherent in the `stack' result become clearer as we move to the `reference' and `inverse' result. | 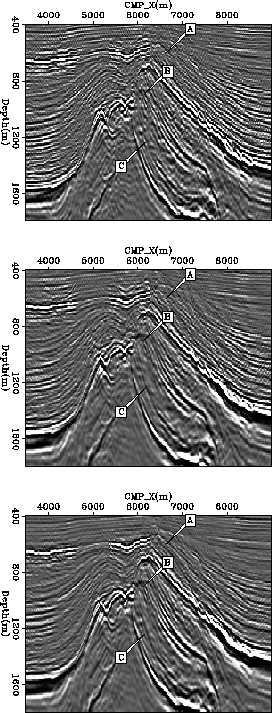 |
![[*]](http://sepwww.stanford.edu/latex2html/movie.gif)
|
iline2
Figure 7 The top panel is the `stack' approach, the center is the `reference' approach, and the bottom panel is the `inverse' approach. All three figures show a in-line located at 3960. . At `A' the complex folding above the salt intrusion come into focus in the `inversion' result. The set of reflectors above the salt come into focus as we advance to more sophisticated techniques at `B'. At `C' we see the salt reflection come into focus as we move to the `reference' and `inverse' approach. | 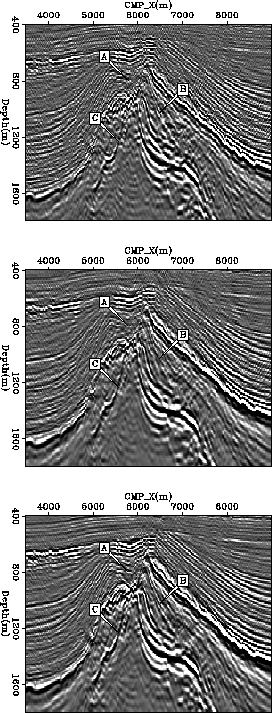 |
![[*]](http://sepwww.stanford.edu/latex2html/movie.gif)