![[*]](http://sepwww.stanford.edu/latex2html/cross_ref_motif.gif) ). I choose a target zone (indicated with the "target" box in Figure
). I choose a target zone (indicated with the "target" box in Figure ![[*]](http://sepwww.stanford.edu/latex2html/cross_ref_motif.gif) ) to see the effects of illumination on imaging close to the salt body.
) to see the effects of illumination on imaging close to the salt body.
The Sigsbee data set was modeled by simulating the geological setting found on the Sigsbee escarpment in the deep-water Gulf of Mexico. The model exhibits the illumination problems due to the complex salt shape, characterized by a rugose salt top (see Figure ![[*]](http://sepwww.stanford.edu/latex2html/cross_ref_motif.gif) ). I choose a target zone (indicated with the "target" box in Figure
). I choose a target zone (indicated with the "target" box in Figure ![[*]](http://sepwww.stanford.edu/latex2html/cross_ref_motif.gif) ) to see the effects of illumination on imaging close to the salt body.
) to see the effects of illumination on imaging close to the salt body.
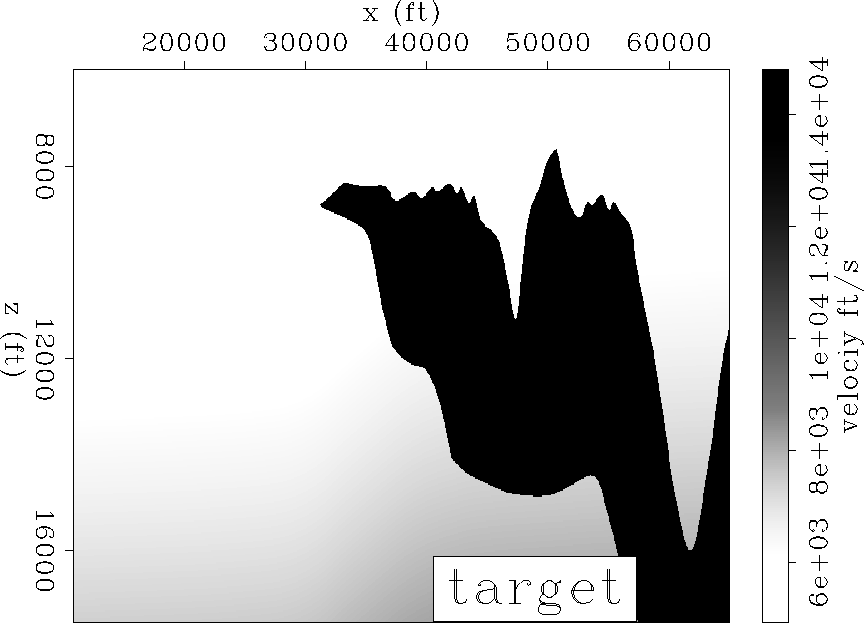 |
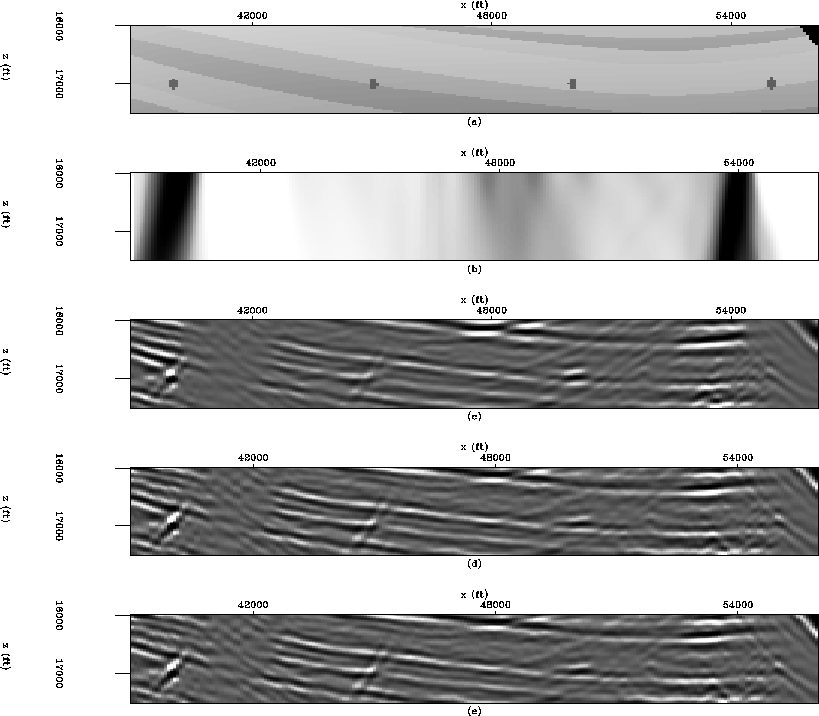
Figure ![[*]](http://sepwww.stanford.edu/latex2html/cross_ref_motif.gif) shows the shot-profile migration image (using a cross-correlation imaging condition) corresponding to the portion of Sigsbee model shown in Figure
shows the shot-profile migration image (using a cross-correlation imaging condition) corresponding to the portion of Sigsbee model shown in Figure ![[*]](http://sepwww.stanford.edu/latex2html/cross_ref_motif.gif) . Notice how the diffractor amplitudes located at 17000 feet depth fade away as they get closer to the salt boundary. The same happens to the reflectors as they get close to the salt .
. Notice how the diffractor amplitudes located at 17000 feet depth fade away as they get closer to the salt boundary. The same happens to the reflectors as they get close to the salt .
 |
Figure ![[*]](http://sepwww.stanford.edu/latex2html/cross_ref_motif.gif) shows the Hessian (
shows the Hessian ( ![]() filter coefficients) at constant depth as the x coordinate moves toward the salt boundary. The subsurface-offset is fixed at
filter coefficients) at constant depth as the x coordinate moves toward the salt boundary. The subsurface-offset is fixed at ![]() feet -the center of the filter lies in the diagonal of the Hessian matrix. Figure
feet -the center of the filter lies in the diagonal of the Hessian matrix. Figure ![[*]](http://sepwww.stanford.edu/latex2html/cross_ref_motif.gif) a shows point 1, with coordinates
a shows point 1, with coordinates ![]() far from the salt body. Figure
far from the salt body. Figure ![[*]](http://sepwww.stanford.edu/latex2html/cross_ref_motif.gif) b shows point 2, with coordinates
b shows point 2, with coordinates ![]() . Figure
. Figure ![[*]](http://sepwww.stanford.edu/latex2html/cross_ref_motif.gif) c shows point 3, with coordinates
c shows point 3, with coordinates ![]() . Figure
. Figure ![[*]](http://sepwww.stanford.edu/latex2html/cross_ref_motif.gif) d shows point 4, with coordinates
d shows point 4, with coordinates ![]() .
.
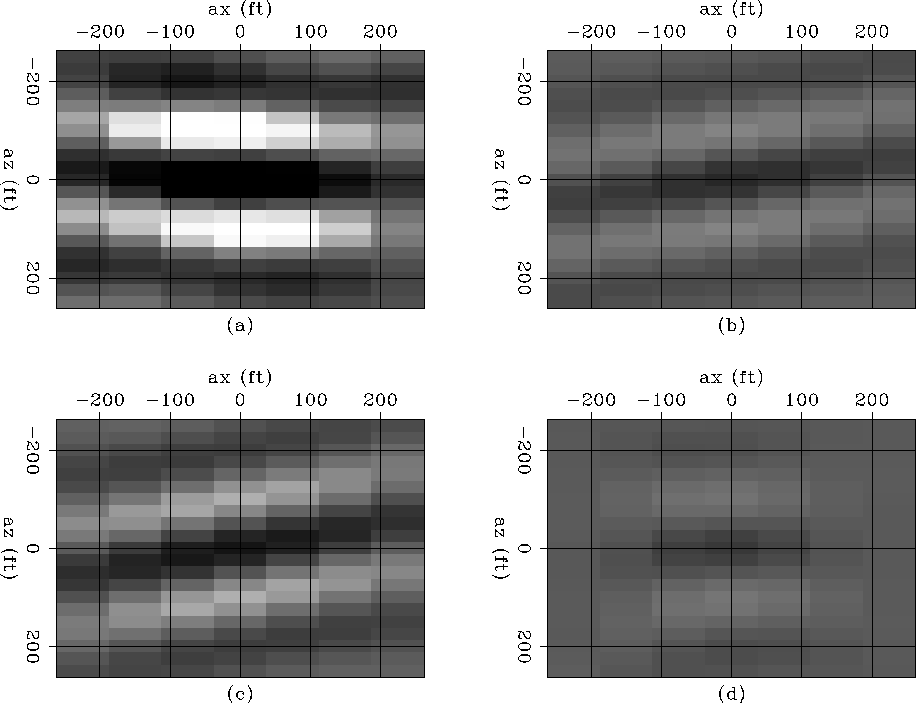 |
The shape of the filter depends not only on the acquisition geometry but also on the velocity model (i.e. presence of the salt body). In the area unaffected by the salt body, the filter is well behaved (Figure ![[*]](http://sepwww.stanford.edu/latex2html/cross_ref_motif.gif) a). However, as we get closer to the salt boundary the complexity of wave propagation starts to affect the shape of the filter. In this case, the filter coefficients diminish in intensity and tilt toward the illuminated angles (Figure
a). However, as we get closer to the salt boundary the complexity of wave propagation starts to affect the shape of the filter. In this case, the filter coefficients diminish in intensity and tilt toward the illuminated angles (Figure ![[*]](http://sepwww.stanford.edu/latex2html/cross_ref_motif.gif) c). This is due to a focusing and defocusing effect created by the salt body.
c). This is due to a focusing and defocusing effect created by the salt body.
To correct the effect of uneven illumination, the least squares image was computed.
Figure ![[*]](http://sepwww.stanford.edu/latex2html/cross_ref_motif.gif) shows a comparison between the migration and the inversion images in the target area. The stratigraphic model is shown in Figure
shows a comparison between the migration and the inversion images in the target area. The stratigraphic model is shown in Figure ![[*]](http://sepwww.stanford.edu/latex2html/cross_ref_motif.gif) a. Notice the four equal-strength point diffractors. Figure
a. Notice the four equal-strength point diffractors. Figure ![[*]](http://sepwww.stanford.edu/latex2html/cross_ref_motif.gif) b shows the illumination, which is the diagonal of the Hessian matrix (dark is high illumination, light is low illumination). Notice the decrease in the illumination as it gets closer to the salt with the exception of a narrow strip where energy focuses close to the salt. The zero subsurface-offset migration result is shown in Figure
b shows the illumination, which is the diagonal of the Hessian matrix (dark is high illumination, light is low illumination). Notice the decrease in the illumination as it gets closer to the salt with the exception of a narrow strip where energy focuses close to the salt. The zero subsurface-offset migration result is shown in Figure ![[*]](http://sepwww.stanford.edu/latex2html/cross_ref_motif.gif) c. The reflectors dim out as they get closer to the salt. Notice how the diffractor amplitudes located at 17000 feet depth fade away as they get closer to the salt. The same happens to the reflectors as they get close to the salt with the exception of a narrow strip coincident with the high illumination. In contrast, Figure
c. The reflectors dim out as they get closer to the salt. Notice how the diffractor amplitudes located at 17000 feet depth fade away as they get closer to the salt. The same happens to the reflectors as they get close to the salt with the exception of a narrow strip coincident with the high illumination. In contrast, Figure ![[*]](http://sepwww.stanford.edu/latex2html/cross_ref_motif.gif) d, and
d, and ![[*]](http://sepwww.stanford.edu/latex2html/cross_ref_motif.gif) e show the zero subsurface-offset inversion results by using equation 4, and 5 respectively. In both cases, the resolution increases (especially to the left of the image) and the section looks more balance.
e show the zero subsurface-offset inversion results by using equation 4, and 5 respectively. In both cases, the resolution increases (especially to the left of the image) and the section looks more balance.
 |
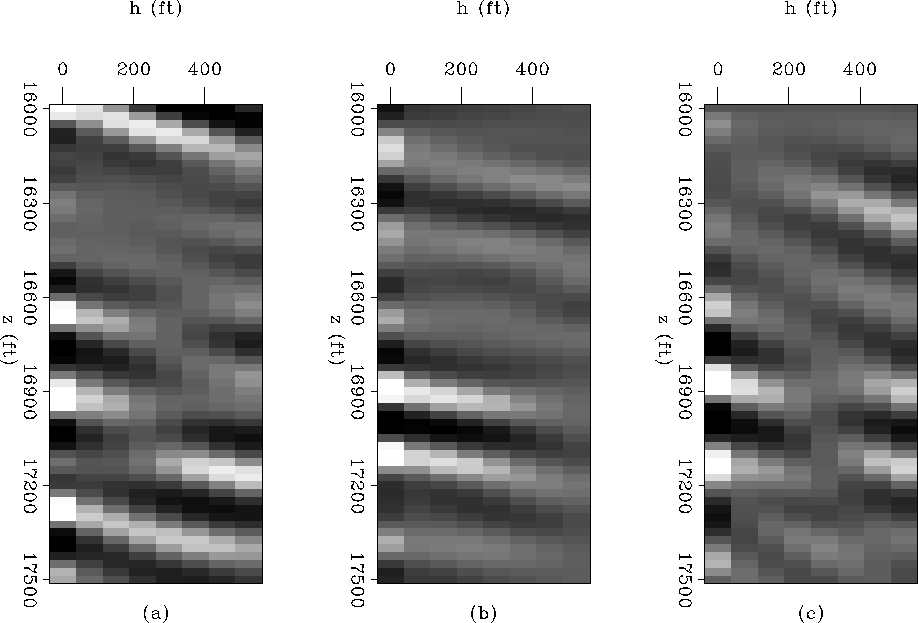
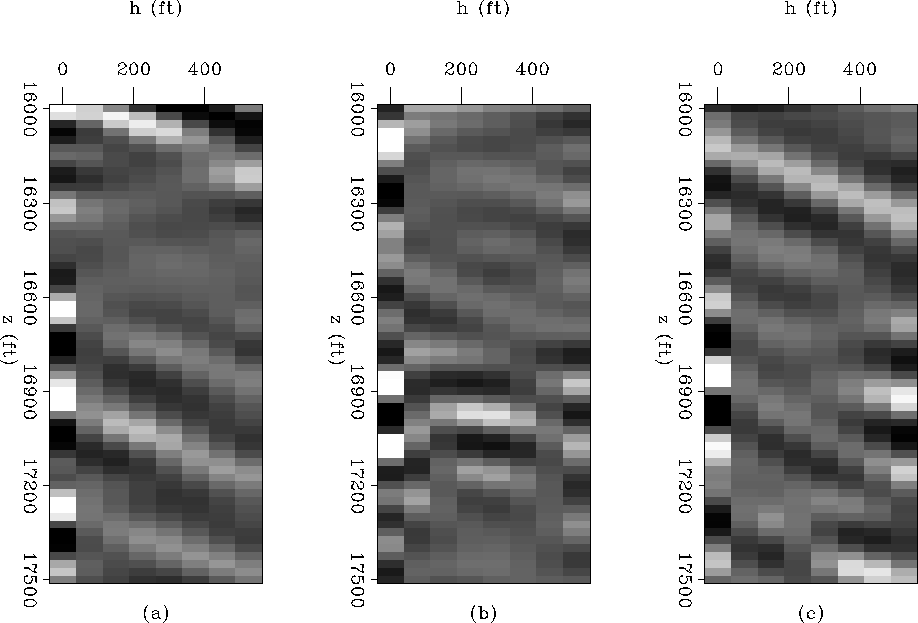
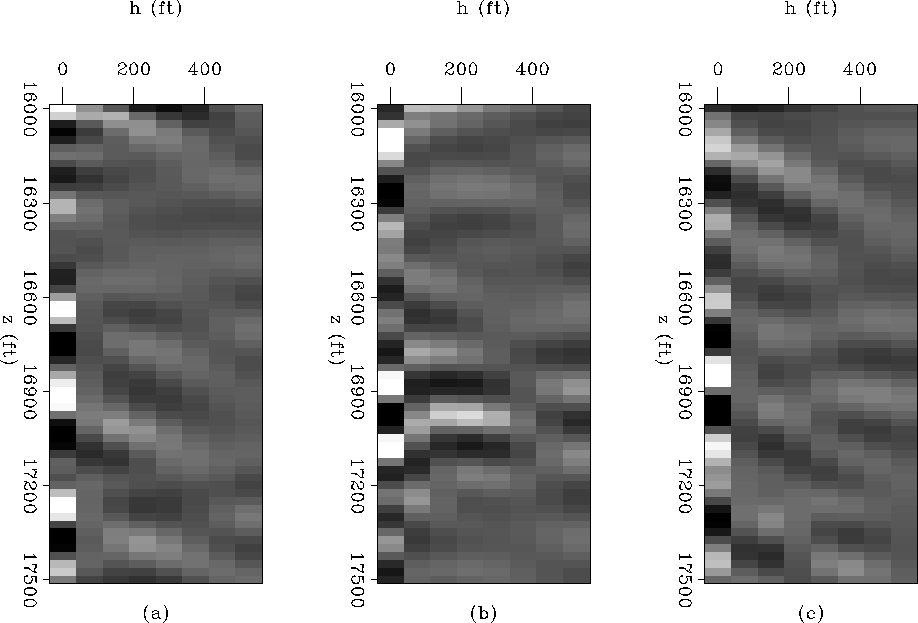
Minor differences exist between Figures ![[*]](http://sepwww.stanford.edu/latex2html/cross_ref_motif.gif) d and
d and ![[*]](http://sepwww.stanford.edu/latex2html/cross_ref_motif.gif) e. That is a result to be expected since the regularization described in equation 5 only penalizes the amplitudes of the image away from zero offset. A more relevant comparison can be seen in Figures
e. That is a result to be expected since the regularization described in equation 5 only penalizes the amplitudes of the image away from zero offset. A more relevant comparison can be seen in Figures ![[*]](http://sepwww.stanford.edu/latex2html/cross_ref_motif.gif) ,
, ![[*]](http://sepwww.stanford.edu/latex2html/cross_ref_motif.gif) , and
, and ![[*]](http://sepwww.stanford.edu/latex2html/cross_ref_motif.gif) . Where the migration image in the subsurface-offset domain is shown in Figure
. Where the migration image in the subsurface-offset domain is shown in Figure ![[*]](http://sepwww.stanford.edu/latex2html/cross_ref_motif.gif) , the subsurface-offset domain inversion with a damping regularization is shown in Figure
, the subsurface-offset domain inversion with a damping regularization is shown in Figure ![[*]](http://sepwww.stanford.edu/latex2html/cross_ref_motif.gif) , and the subsurface-offset domain inversion with regularization that penalizes the energy in the image not focused at zero subsurface-offset is shown in
, and the subsurface-offset domain inversion with regularization that penalizes the energy in the image not focused at zero subsurface-offset is shown in ![[*]](http://sepwww.stanford.edu/latex2html/cross_ref_motif.gif) . Notice how the images differ away from zero subsurface-offset, being the latest the one with the energy more focused at zero.
. Notice how the images differ away from zero subsurface-offset, being the latest the one with the energy more focused at zero.
 |
 |
 |