

Next: Gulf of Mexico example
Up: Multiple attenuation: Theory and
Previous: Testing the Spitz approximation
The goal of this section is to compare the pattern-based method
with the more conventional adaptive subtraction on a synthetic dataset
provided by BP. These two methods have very different properties.
In one hand, adaptive subtraction assumes implicitly that the signal has minimum
energy. In addition, the separation is very fast because the matching
filters and the primaries are usually estimated simultaneously with
Wiener-Levinson type methods. On the other hand, the proposed
approach assumes that the signal and noise have different
patterns. Unfortunately, high dimension filters for primaries and multiples need to
be estimated first before starting the separation, which adds to the
total cost of the method. Therefore, the pattern-based
approach can be much slower than adaptive subtraction.
Computing considerations aside, the two methods can perform
very differently according to the geological setting. Here, both
are tested in a salt environment with a synthetic dataset.
This dataset was primarily designed to conduct blind tests
for velocity estimation methods. Consequently, no structural information is known.
The adaptive subtraction technique used in this section is based
on the estimation of 2-D, time/space varying matching filters
Rickett et al. (2001). The filters are computed for one shot
gather at a time. With the pattern-based approach, 3-D filters are used
for the multiple attenuation. Ideally, 3-D filters should be
also used with adaptive subtraction. However, matching filters are
generally not estimated that way.
The multiple model is computed with SRMP. Therefore, only multiples
bouncing at least once at the water surface will be modeled and subtracted.
The synthetic model has an offset spacing of 12.5 m
and a shot separation of 50 m. To make the multiple prediction work,
the offset axis is sampled down to 50 m. Figure ![[*]](http://sepwww.stanford.edu/latex2html/cross_ref_motif.gif) shows
one constant offset section from -15,000 m to +15,000 m with primaries
and multiples. This section of the dataset is particularly interesting because
of the diffractions visible throughout. A possible interpretation of
these diffractions is the presence of salt bodies with a rugose top
(similar to what we see with the Sigsbee2B dataset).
The multiple model is shown in Figure
shows
one constant offset section from -15,000 m to +15,000 m with primaries
and multiples. This section of the dataset is particularly interesting because
of the diffractions visible throughout. A possible interpretation of
these diffractions is the presence of salt bodies with a rugose top
(similar to what we see with the Sigsbee2B dataset).
The multiple model is shown in Figure ![[*]](http://sepwww.stanford.edu/latex2html/cross_ref_motif.gif) for
the same offset. DT points to diffraction tails
where the model is not properly rendering the multiples in the data.
Figure
for
the same offset. DT points to diffraction tails
where the model is not properly rendering the multiples in the data.
Figure ![[*]](http://sepwww.stanford.edu/latex2html/cross_ref_motif.gif) illustrates on a zero-offset example why
diffractions are difficult to predict. The main reasons are that
far offset data are not recorded and/or the scatter points are out of plane.
Besides these few imperfections, the model looks very
faithful to the actual multiples.
illustrates on a zero-offset example why
diffractions are difficult to predict. The main reasons are that
far offset data are not recorded and/or the scatter points are out of plane.
Besides these few imperfections, the model looks very
faithful to the actual multiples.
scatter
Figure 10 Illustration of a pegleg multiple
with a bounce on a scatter point recorded at zero-offset. These
events are difficult to model because of the lack of far and/or
crossline offsets.
|
|  |

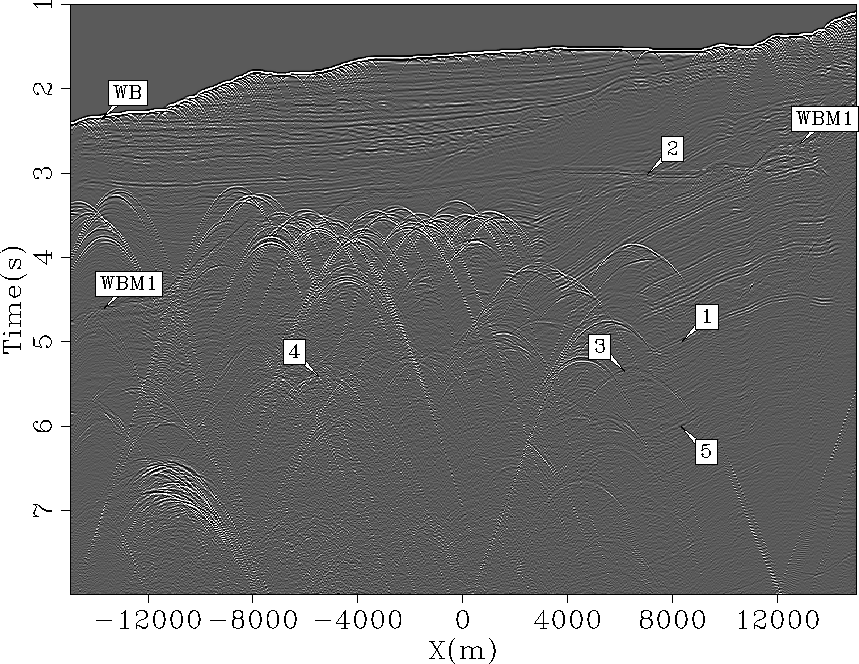
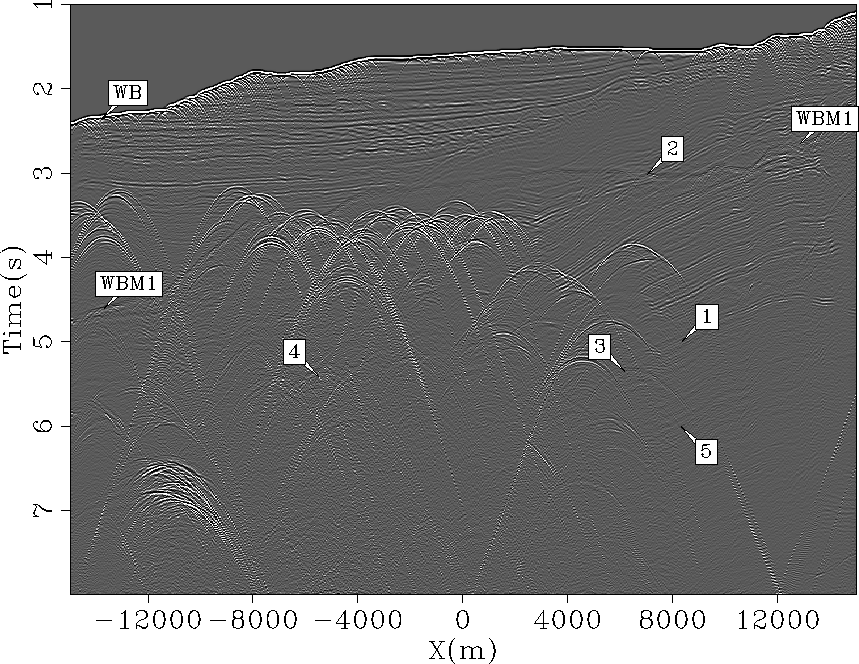
The result of adaptive subtraction is shown for one offset section in
Figure ![[*]](http://sepwww.stanford.edu/latex2html/cross_ref_motif.gif) and the result of pattern-based subtraction is
shown in Figure
and the result of pattern-based subtraction is
shown in Figure ![[*]](http://sepwww.stanford.edu/latex2html/cross_ref_motif.gif) . The adaptive subtraction is doing a
decent job everywhere. However, some multiples are still visible.
For example, '1' in Figure
. The adaptive subtraction is doing a
decent job everywhere. However, some multiples are still visible.
For example, '1' in Figure ![[*]](http://sepwww.stanford.edu/latex2html/cross_ref_motif.gif) points to a location where
multiples overlap with primaries and are not attenuated. In contrast,
the pattern-based subtraction (i.e., Figure
points to a location where
multiples overlap with primaries and are not attenuated. In contrast,
the pattern-based subtraction (i.e., Figure ![[*]](http://sepwww.stanford.edu/latex2html/cross_ref_motif.gif) )
seems to do a better job attenuating these events.
The same is true for arrows '2' and '5'. The diffracted multiples
(arrows '3' and '4') are also
attenuated more effectively with the pattern-based approach.
)
seems to do a better job attenuating these events.
The same is true for arrows '2' and '5'. The diffracted multiples
(arrows '3' and '4') are also
attenuated more effectively with the pattern-based approach.
Because no velocity analysis was conducted with this dataset, no stacks
are presented. Alternatively, close-ups of constant offset sections
are shown to illustrate strengths and weaknesses of the two different
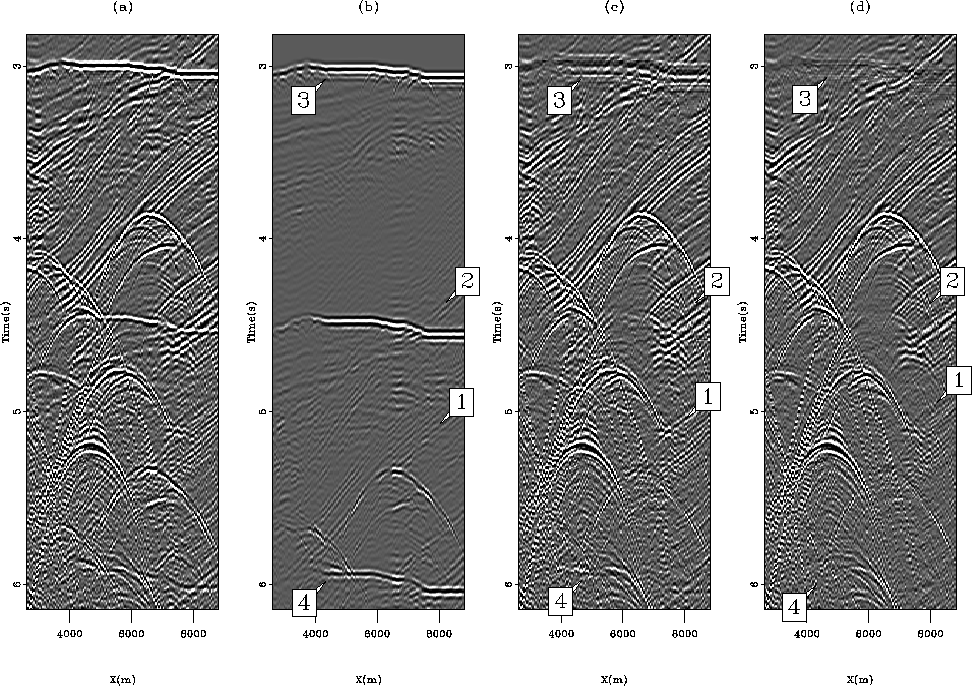
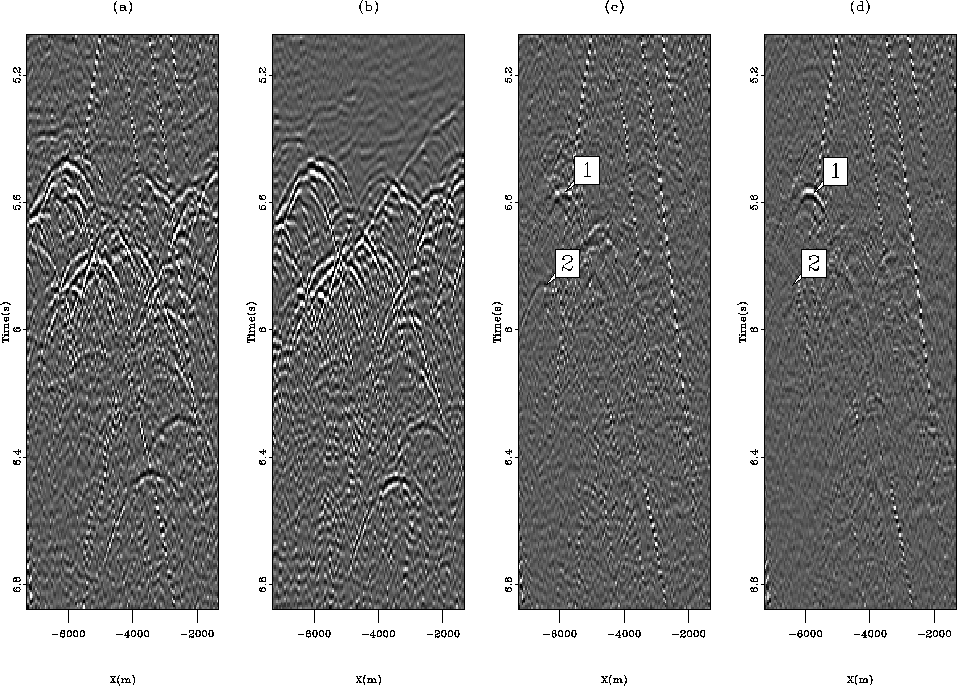
approaches. Figure ![[*]](http://sepwww.stanford.edu/latex2html/cross_ref_motif.gif) shows a comparison between the
input data, the multiple model, the estimated primaries with the
adaptive subtraction and the estimated primaries with the
pattern-based technique. The offset is 700 m. As shown by the arrows,
the pattern-based method performs generally better. The same
conclusions hold in Figure
shows a comparison between the
input data, the multiple model, the estimated primaries with the
adaptive subtraction and the estimated primaries with the
pattern-based technique. The offset is 700 m. As shown by the arrows,
the pattern-based method performs generally better. The same
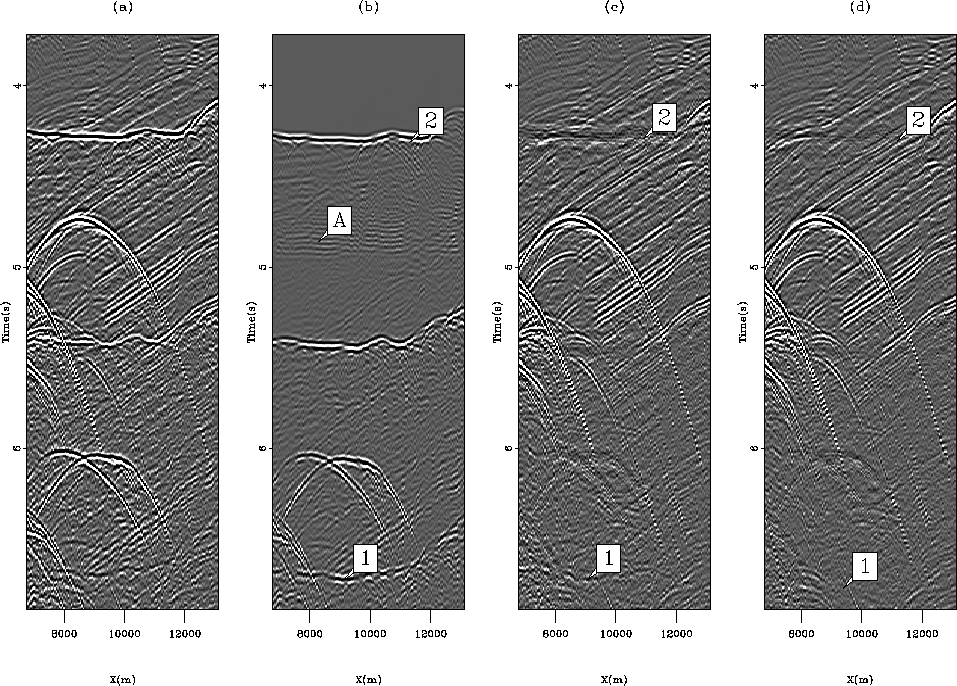
conclusions hold in Figure ![[*]](http://sepwww.stanford.edu/latex2html/cross_ref_motif.gif) . Note in Figure
. Note in Figure
![[*]](http://sepwww.stanford.edu/latex2html/cross_ref_motif.gif) b aliasing artifacts due to the coarse sampling of
the offset axis for the multiple prediction van Dedem (2002).
b aliasing artifacts due to the coarse sampling of
the offset axis for the multiple prediction van Dedem (2002).
Sometimes, it can be rather difficult to see if multiples are removed
or not by simply looking at 2-D planes. Figure ![[*]](http://sepwww.stanford.edu/latex2html/cross_ref_motif.gif) c shows
one event at '2' that seems to be a primary. However, by looking at the
shot gathers (not shown here),
it appears that this event is a multiple that the pattern-based
approach was able to attenuate.
c shows
one event at '2' that seems to be a primary. However, by looking at the
shot gathers (not shown here),
it appears that this event is a multiple that the pattern-based
approach was able to attenuate.
One shortcoming of the pattern-recognition technique is that it relies
on the Spitz approximation to provide a signal model if nothing else
is available. By construction, the signal and noise filters will
span different components of the data space.
Therefore, the estimated primaries and multiples are uncorrelated.
This simple fact suggests that with the Spitz approximation, higher
dimension filters are preferred because primaries and multiples have
fewer chances to look similar.
Figure ![[*]](http://sepwww.stanford.edu/latex2html/cross_ref_motif.gif) shows an example where primaries are
damaged by the pattern-based method. For instance in Figure
shows an example where primaries are
damaged by the pattern-based method. For instance in Figure
![[*]](http://sepwww.stanford.edu/latex2html/cross_ref_motif.gif) a, we see at '2' a primary that is attenuated by the
PEFs (Figure
a, we see at '2' a primary that is attenuated by the
PEFs (Figure ![[*]](http://sepwww.stanford.edu/latex2html/cross_ref_motif.gif) d) but well preserved by the adaptive
subtraction (Figure
d) but well preserved by the adaptive
subtraction (Figure ![[*]](http://sepwww.stanford.edu/latex2html/cross_ref_motif.gif) c). Here the primaries and
multiples (Figure
c). Here the primaries and
multiples (Figure ![[*]](http://sepwww.stanford.edu/latex2html/cross_ref_motif.gif) b) exhibit similar
patterns and the signal may have minimum energy.
Using the Spitz approximation, event '2' is identified as
noise and removed as such. For event '3', it is quite difficult to say
if multiples are removed in Figure
b) exhibit similar
patterns and the signal may have minimum energy.
Using the Spitz approximation, event '2' is identified as
noise and removed as such. For event '3', it is quite difficult to say
if multiples are removed in Figure ![[*]](http://sepwww.stanford.edu/latex2html/cross_ref_motif.gif) d or if primaries are
preserved in Figure
d or if primaries are
preserved in Figure ![[*]](http://sepwww.stanford.edu/latex2html/cross_ref_motif.gif) c. Looking at the
corresponding shot gathers did not help to make a decision because the
multiples are very strong. Event '4' is preserved with the
adaptive subtraction and '1' and '5' are well recovered with the
pattern-based approach.
c. Looking at the
corresponding shot gathers did not help to make a decision because the
multiples are very strong. Event '4' is preserved with the
adaptive subtraction and '1' and '5' are well recovered with the
pattern-based approach.
This synthetic example indicates that the pattern-based approach tend
to attenuate the multiples more accurately than adaptive subtraction
when the multiples are not correlated with the primaries.
This illustrates that higher dimensions filters should
be preferred to discriminate the noise and signal more effectively. The next
section shows how the pattern-based approach performs on a field dataset
from the Gulf of Mexico.
data
Figure 11 Constant offset section (h=500 m) of
the data with multiples. DTs point to the tails of diffracted
multiples. These pegleg multiples bounce once on the seafloor and
once on the scater. Arrow WB shows the water bottom, WBM1 the first order
surface-related multiple, and WBM2 the second order surface-related multiple.


 mult
mult
Figure 12 Constant offset section (h=550 m) of the
estimated multiples. The multiples are accurately modeled except for
the diffracted multiples, shown as DT, for which the limited range of
offsets and number of shots hamper any attempt at modeling the
diffraction tails. Arrow WBM1 shows the first order
surface-related multiple, and WBM2 the second order surface-related multiple.


 dsign
dsign
Figure 13 Constant offset section (h=550 m) of
the estimated primaries with adaptive subtraction. The arrows point
to locations where multiples are still present. Arrow WBM1 shows the
remaining energy for the first order surface-related multiple.


 sign
sign
Figure 14 constant offset section (h=550 m) of
the estimated primaries with pattern recognition. Multiples are
better attenuated than in Figure ![[*]](http://sepwww.stanford.edu/latex2html/cross_ref_motif.gif) . Arrow WBM1 shows the
remaining energy for the first order surface-related multiple.
. Arrow WBM1 shows the
remaining energy for the first order surface-related multiple.


 compwin1
Figure 15 Constant offset sections (h=700 m)
for (a) the input data, (b) the multiple model, (c) the estimated
primaries with adaptive subtraction, and (d) estimated primaries
with the pattern-based approach. Arrows point to locations where the
pattern-based approach attenuates multiples significantly better
than the adaptive subtraction.


 compwin6
Figure 16 Constant offset sections (h=4550 m)
for (a) the input data, (b) the multiple model, (c) the estimated
primaries with adaptive subtraction, and (d) estimated primaries
with the pattern-based approach. Arrow A points to aliasing effects due to
the offset sampling of the shot gathers. The pattern-based approach
attenuates the multiples better than the adaptive subtraction in
'1' and '2'.


 compwin8
Figure 17 Constant offset sections (h=3300 m)
for (a) the input data, (b) the multiple model, (c) the estimated
primaries with adaptive subtraction, and (d) estimated primaries
with the pattern-based approach. '1' points to a primary that the
pattern-recognition preserves very well. '2' points to an event that
is attenuated with the pattern-based approach but not with the
adaptive subtraction in (c). Though not shown here, a close
inspection of the corresponding shot gathers suggests that '2' is
actually a multiple.


 compwin12
Figure 18 Constant offset sections (h=5050 m)
for (a) the input data, (b) the multiple model, (c) the estimated
primaries with adaptive subtraction, and (d) estimated primaries
with the pattern-based approach. '1' and '5' show events better
preserved with the pattern-based method. '2' and '1' are better
recovered with the adaptive subtraction. '4' seems to point to a
primary that the adaptive subtraction is able to save. Because the
area is contaminated with strong multiples, it is difficult to know
without a stratigraphic model if '3' is a primary or not.


Next: Gulf of Mexico example
Up: Multiple attenuation: Theory and
Previous: Testing the Spitz approximation
Stanford Exploration Project
5/5/2005
![[*]](http://sepwww.stanford.edu/latex2html/cross_ref_motif.gif) shows
one constant offset section from -15,000 m to +15,000 m with primaries
and multiples. This section of the dataset is particularly interesting because
of the diffractions visible throughout. A possible interpretation of
these diffractions is the presence of salt bodies with a rugose top
(similar to what we see with the Sigsbee2B dataset).
The multiple model is shown in Figure
shows
one constant offset section from -15,000 m to +15,000 m with primaries
and multiples. This section of the dataset is particularly interesting because
of the diffractions visible throughout. A possible interpretation of
these diffractions is the presence of salt bodies with a rugose top
(similar to what we see with the Sigsbee2B dataset).
The multiple model is shown in Figure ![[*]](http://sepwww.stanford.edu/latex2html/cross_ref_motif.gif) for
the same offset. DT points to diffraction tails
where the model is not properly rendering the multiples in the data.
Figure
for
the same offset. DT points to diffraction tails
where the model is not properly rendering the multiples in the data.
Figure ![[*]](http://sepwww.stanford.edu/latex2html/cross_ref_motif.gif) illustrates on a zero-offset example why
diffractions are difficult to predict. The main reasons are that
far offset data are not recorded and/or the scatter points are out of plane.
Besides these few imperfections, the model looks very
faithful to the actual multiples.
illustrates on a zero-offset example why
diffractions are difficult to predict. The main reasons are that
far offset data are not recorded and/or the scatter points are out of plane.
Besides these few imperfections, the model looks very
faithful to the actual multiples.


