


The raw data (Figure ![[*]](http://sepwww.stanford.edu/latex2html/cross_ref_motif.gif) ), irregularly distributed across the surface,
are 132,044 triples, (xi,yi,zi), where xi ranges over about
12 km and where yi ranges over about 20 km. The data need to be interpolated
to a regular grid using inversion to facilitate the processing, such
as noise removal, and also to create a map that can
be easily analyzed for identifying artifacts and geology.
), irregularly distributed across the surface,
are 132,044 triples, (xi,yi,zi), where xi ranges over about
12 km and where yi ranges over about 20 km. The data need to be interpolated
to a regular grid using inversion to facilitate the processing, such
as noise removal, and also to create a map that can
be easily analyzed for identifying artifacts and geology.
The pertinence of this dataset to our daily geophysical problems
is three fold. First, we often have to do interpolation of seismic maps
Britze (1998), potential field data
Guspi and Introcaso (2000) or other measurements to compensate for the
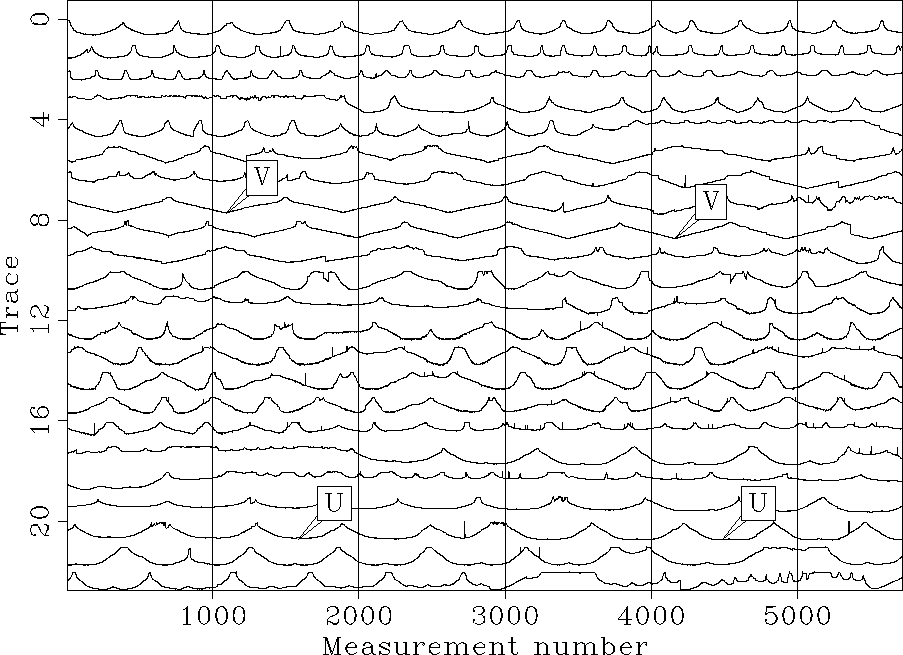
sparseness and irregularities of acquisition geometries. Second, as seen in the raw data in Figure
, some noise bursts related to spurious
electronic signals (glitches) and/or positioning errors need to be accounted for
in the inversion scheme. This problem is common, for example, in
tomography Bube and Langan (1997), deconvolution of noisy data
Chapman and Barrodale (1983) and velocity analysis (Chapter )
where outliers can degrade the final model
if we assume a gaussian distribution of the noise.
Third, the final image of the Sea of Galilee will display the
vessel tracks because the measurements on the lake were made on different days,
with different weather and human conditions. We can directly link this
problem to the goal of removing the acquisition footprint with 3-D seismic
data Chemingui and Biondi (2002); Duijndam et al. (2000); Schuster and Liu (2001).
Therefore, the interpolation of the data from the Sea of Galilee becomes a spiky noise
and a coherent noise attenuation problem.
 |


There is a long list of students at the Stanford Exploration Project
who attempted to produce a satisfying map of the sea bottom.
Fomel and Claerbout (1995) introduced the ![]() norm
via Iteratively Reweighted Least Squares (IRLS) to eliminate the noise bursts
present in the data. Recently, Brown (2001) attempted
to remove acquisition tracks by estimating the systematic error
between tracks at crossing points. Karpushin and Brown (2001) used
a bank of prediction-error filters (PEFs) to whiten the residual along
tracks. However, in most of these results, there is a loss of
resolution that hampers our goal of seeing small features in the final
image.
norm
via Iteratively Reweighted Least Squares (IRLS) to eliminate the noise bursts
present in the data. Recently, Brown (2001) attempted
to remove acquisition tracks by estimating the systematic error
between tracks at crossing points. Karpushin and Brown (2001) used
a bank of prediction-error filters (PEFs) to whiten the residual along
tracks. However, in most of these results, there is a loss of
resolution that hampers our goal of seeing small features in the final
image.
Techniques developed in the preceding Chapters, i.e., the Huber norm
from Chapter and the modeling approach of
Chapter , are both used to tackle the noise problems
encountered with the mapping of this dataset. This data example
also illustrates that the modeling of the tracks gives better results
than filtering.