

Next: Conclusions
Up: Lomask and Biondi: Image
Previous: Methodology
We tested this method on a 2D section taken from a Gulf of Mexico data set provided by WesternGeco.
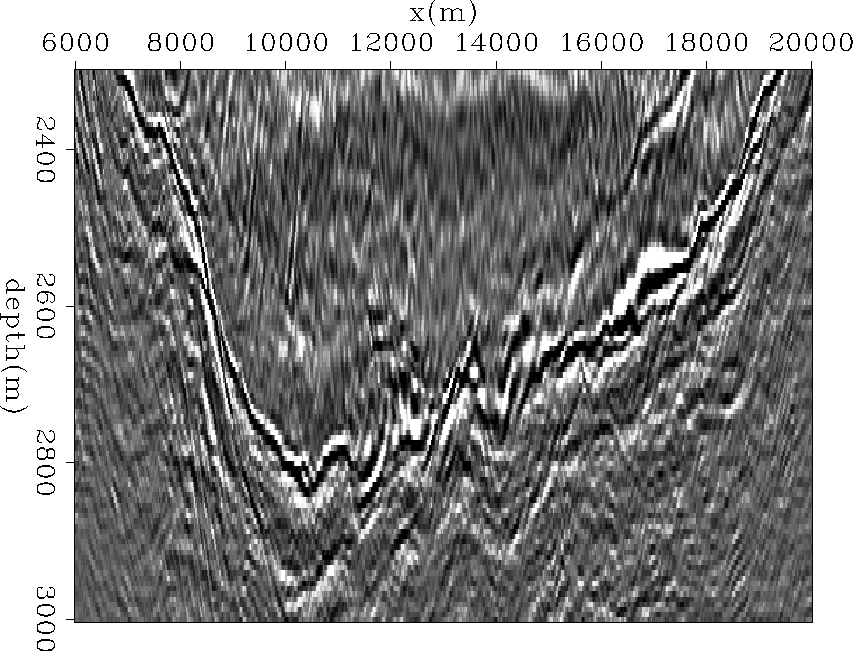
Figure ![[*]](http://sepwww.stanford.edu/latex2html/cross_ref_motif.gif) shows a base of salt reflection. Although it is discontinuous, the human eye can see how it should be picked without too much uncertainty.
shows a base of salt reflection. Although it is discontinuous, the human eye can see how it should be picked without too much uncertainty.
gom.data
Figure 5 A 2D seismic section with a salt boundary from the Gulf of Mexico.


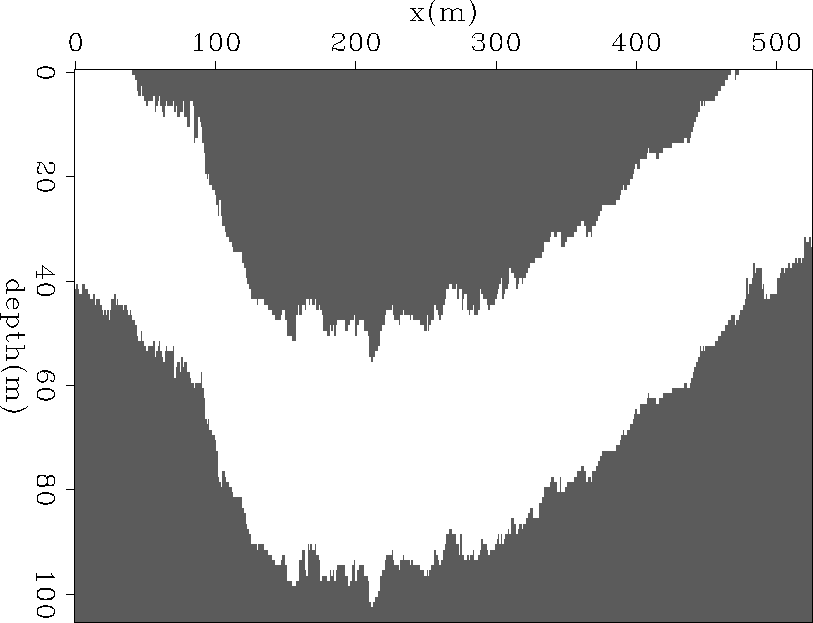
We first ran the standard segmentation method on the entire image in Figure ![[*]](http://sepwww.stanford.edu/latex2html/cross_ref_motif.gif) with a short search distance and coarse sampling. We then shifted the result up and down 20 samples to get the mask shown in Figure
with a short search distance and coarse sampling. We then shifted the result up and down 20 samples to get the mask shown in Figure ![[*]](http://sepwww.stanford.edu/latex2html/cross_ref_motif.gif) .
.
gom.mask_in
Figure 6 A binary mask defining the bounds of the salt boundary. This was generated by first running the image segmentation method on the entire image with short search distances and sparse sampling. In this case, the mask reduces the size of the problem by a factor of 2.


Now our image is thinner and defined by that mask. We ran the standard segmentation method on the masked area. The resulting eigenvector ( ) used to partition the image is shown in Figure
 ![[*]](http://sepwww.stanford.edu/latex2html/cross_ref_motif.gif) . In principle, this eigenvector would be clipped to track the salt. Unfortunately, it is dominated by a low frequency trend and will create an erroneous vertical cut.
. In principle, this eigenvector would be clipped to track the salt. Unfortunately, it is dominated by a low frequency trend and will create an erroneous vertical cut.
gom.eig_nrand
Figure 7 The eigenvector that is used to partition the image using our old segmentation algorithm after the mask in Figure ![[*]](http://sepwww.stanford.edu/latex2html/cross_ref_motif.gif) is applied. Hints of the salt boundary can be seen but is obscured by the overall low frequency trend from left to right. This will not produce a satisfactory segmentation result.
is applied. Hints of the salt boundary can be seen but is obscured by the overall low frequency trend from left to right. This will not produce a satisfactory segmentation result.


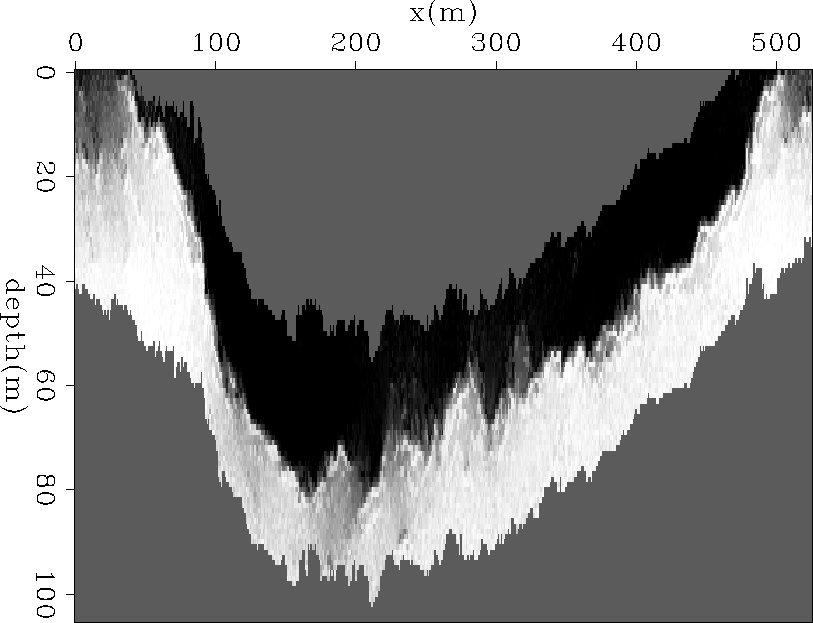
The eigenvector result of applying the random bounds approach is shown in Figure ![[*]](http://sepwww.stanford.edu/latex2html/cross_ref_motif.gif) . It is clear that the salt interface can be gleaned from this image.
. It is clear that the salt interface can be gleaned from this image.
gom.eig_rand
Figure 8 The eigenvector that is used to partition the image using our new approach with random bounds. The salt boundary is conspicuous in this image and can be extracted easily.


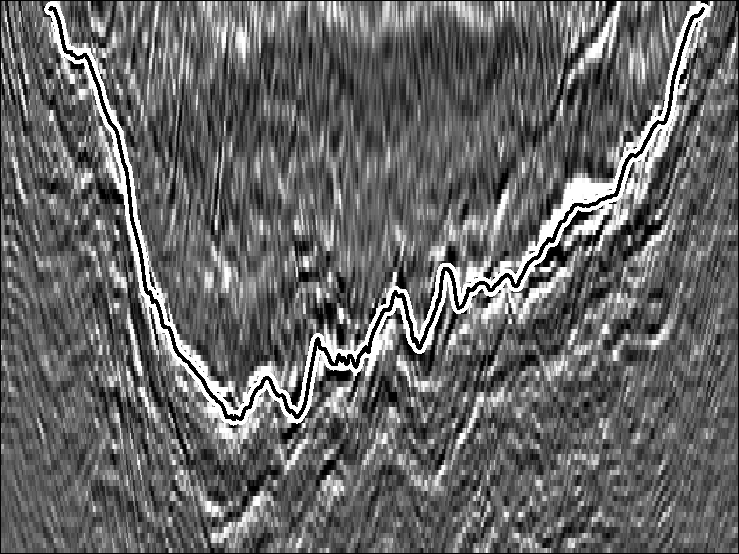
The resulting tracked salt boundary is displayed in Figure ![[*]](http://sepwww.stanford.edu/latex2html/cross_ref_motif.gif) . It does an excellent job of tracking the salt boundary. The base salt tracking result is also overlain on the full 2D section in Figure
. It does an excellent job of tracking the salt boundary. The base salt tracking result is also overlain on the full 2D section in Figure ![[*]](http://sepwww.stanford.edu/latex2html/cross_ref_motif.gif) .
.
gom.horiz2
Figure 9 The boundary is garnered from the image in Figure ![[*]](http://sepwww.stanford.edu/latex2html/cross_ref_motif.gif) and overlain on the original base of salt data. It does a very good job of tracking the boundary.
and overlain on the original base of salt data. It does a very good job of tracking the boundary.


 gom_horiz2_full
Figure 10 The boundary is overlain on a larger 2D section.


Next: Conclusions
Up: Lomask and Biondi: Image
Previous: Methodology
Stanford Exploration Project
5/3/2005
![[*]](http://sepwww.stanford.edu/latex2html/cross_ref_motif.gif) shows a base of salt reflection. Although it is discontinuous, the human eye can see how it should be picked without too much uncertainty.
shows a base of salt reflection. Although it is discontinuous, the human eye can see how it should be picked without too much uncertainty.

![[*]](http://sepwww.stanford.edu/latex2html/cross_ref_motif.gif) with a short search distance and coarse sampling. We then shifted the result up and down 20 samples to get the mask shown in Figure
with a short search distance and coarse sampling. We then shifted the result up and down 20 samples to get the mask shown in Figure ![[*]](http://sepwww.stanford.edu/latex2html/cross_ref_motif.gif) .
.

![]() ) used to partition the image is shown in Figure
) used to partition the image is shown in Figure ![[*]](http://sepwww.stanford.edu/latex2html/cross_ref_motif.gif) . In principle, this eigenvector would be clipped to track the salt. Unfortunately, it is dominated by a low frequency trend and will create an erroneous vertical cut.
. In principle, this eigenvector would be clipped to track the salt. Unfortunately, it is dominated by a low frequency trend and will create an erroneous vertical cut.

![[*]](http://sepwww.stanford.edu/latex2html/cross_ref_motif.gif) is applied. Hints of the salt boundary can be seen but is obscured by the overall low frequency trend from left to right. This will not produce a satisfactory segmentation result.
is applied. Hints of the salt boundary can be seen but is obscured by the overall low frequency trend from left to right. This will not produce a satisfactory segmentation result.
![[*]](http://sepwww.stanford.edu/latex2html/cross_ref_motif.gif) . It is clear that the salt interface can be gleaned from this image.
. It is clear that the salt interface can be gleaned from this image.

![[*]](http://sepwww.stanford.edu/latex2html/cross_ref_motif.gif) . It does an excellent job of tracking the salt boundary. The base salt tracking result is also overlain on the full 2D section in Figure
. It does an excellent job of tracking the salt boundary. The base salt tracking result is also overlain on the full 2D section in Figure ![[*]](http://sepwww.stanford.edu/latex2html/cross_ref_motif.gif) .
.

![[*]](http://sepwww.stanford.edu/latex2html/cross_ref_motif.gif) and overlain on the original base of salt data. It does a very good job of tracking the boundary.
and overlain on the original base of salt data. It does a very good job of tracking the boundary.
