![[*]](http://sepwww.stanford.edu/latex2html/cross_ref_motif.gif) , is comprised of three materials with differing
elastic properties.
, is comprised of three materials with differing
elastic properties.
In this section, we present numerical tests of the theory developed
above. We provide the proof-of-concept using a plane-wave teleseismic
data set Shragge (2003). This data set is comprised
of elastic wavefields, which allows us to test both the diffracted and
converted scattering scenarios. The idealized model, shown in
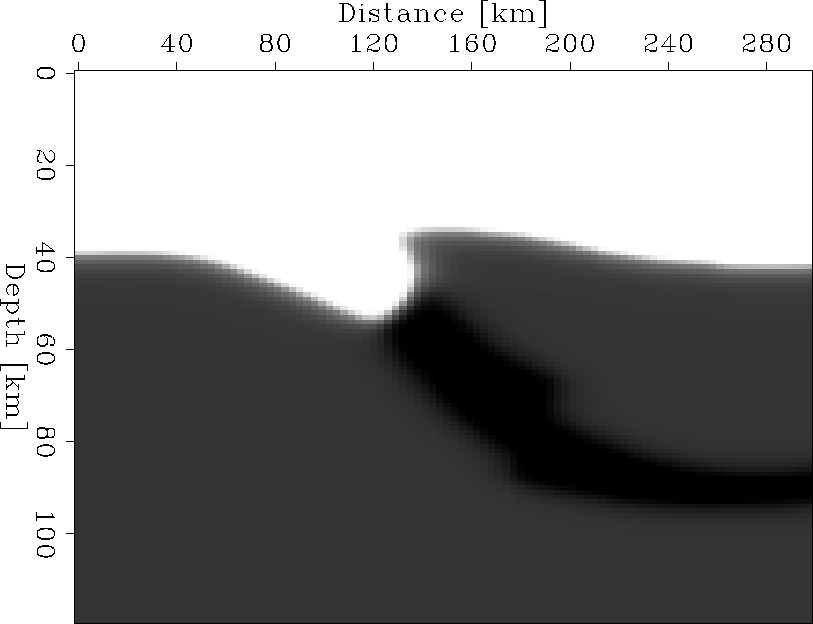
Figure ![[*]](http://sepwww.stanford.edu/latex2html/cross_ref_motif.gif) , is comprised of three materials with differing
elastic properties.
, is comprised of three materials with differing
elastic properties.
 |
A low-velocity crustal layer (white) overlies a faster upper mantle (dark gray). At the location of the suture, crustal material from the lithospheric block to the left bifurcates, with the lower segment descending into the mantle. At the depth of approximately 40 km, the relict (black) converts to velocities and density higher than the surrounding mantle (with a proportionally greater increase in shear-wave velocity) and thereafter folds and thins to the right of the model. Structural dips in the model are generally quite low (i.e., less than 20); however, sub-vertical discontinuities are present in the zone of short-wavelength structure between x=120 and x=160.
Several sets of two-component seismograms were computed through this
model using a 2-D, elastic pseudo-spectral finite-difference code
Kosloff et al. (1990). The seismograms comprise a suite of plane P-wave
sources interacting with the model over a range of incident horizontal
slownesses, ![]() skm-1. We
rotated the output data from the computational orientation (i.e.,
skm-1. We
rotated the output data from the computational orientation (i.e., ![]() ) to a wave-vector orientation (i.e.,
) to a wave-vector orientation (i.e., ![]() ) via the free-surface transfer matrix Kennett (1991).
) via the free-surface transfer matrix Kennett (1991).
Figure ![[*]](http://sepwww.stanford.edu/latex2html/cross_ref_motif.gif) presents examples of P-wave (top panels) and
S-wave (bottom panels) data sections. The left and right panels
show data for plane-wave sources incident from the left and right
sides of the model in Figure
presents examples of P-wave (top panels) and
S-wave (bottom panels) data sections. The left and right panels
show data for plane-wave sources incident from the left and right
sides of the model in Figure ![[*]](http://sepwww.stanford.edu/latex2html/cross_ref_motif.gif) , respectively.
, respectively.
 |
We are interested in imaging are the P-P diffracted waves from the zone of short wavelength structure immediately following the plane-wave arrival, and the P-S diffracted and converted waves arriving shortly thereafter.
This vector-wavefield processing yields P- and S-wave data
sections appropriate for use in shot-profile migration
Shragge et al. (2005). We migrated the data sections
for both P-P and P-S scattering modes. We present the
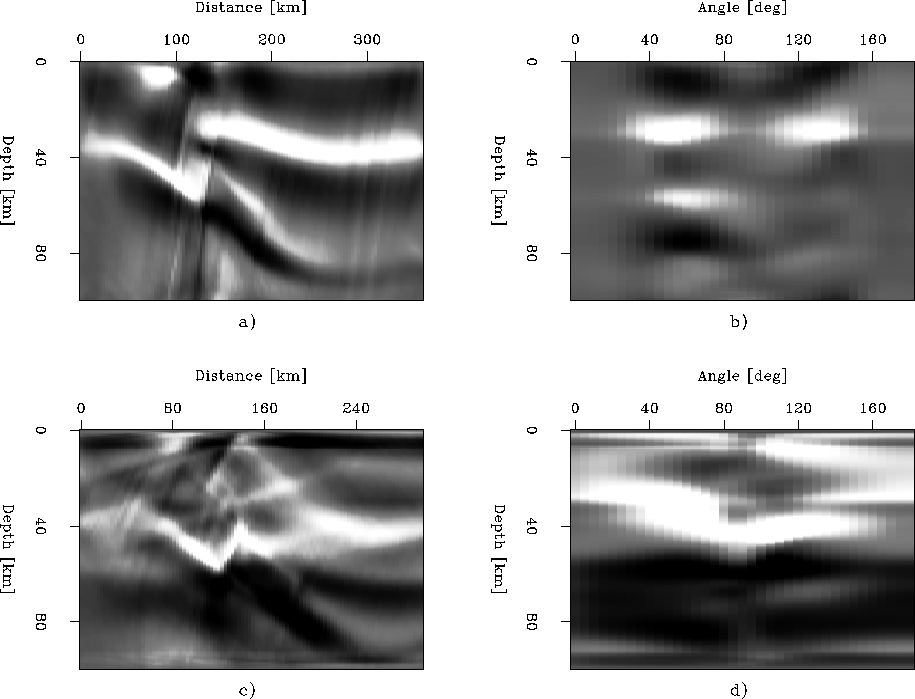
image volumes in Figures ![[*]](http://sepwww.stanford.edu/latex2html/cross_ref_motif.gif) and
and ![[*]](http://sepwww.stanford.edu/latex2html/cross_ref_motif.gif) , where horizontal
and vertical ADCIGs are shown in the upper and lower panels,
respectively. The upper panel of Figure
, where horizontal
and vertical ADCIGs are shown in the upper and lower panels,
respectively. The upper panel of Figure ![[*]](http://sepwww.stanford.edu/latex2html/cross_ref_motif.gif) shows a vertical
streak around 130 km in midpoint. This indicates that because of the low
geologic dip angles in this model, horizontal ADCIGs computed from
forward-scattered P-P migrations afford low resolution of the imaged
structure, and are not likely to be useful either for MVA or imaging.
shows a vertical
streak around 130 km in midpoint. This indicates that because of the low
geologic dip angles in this model, horizontal ADCIGs computed from
forward-scattered P-P migrations afford low resolution of the imaged
structure, and are not likely to be useful either for MVA or imaging.
 |
In addition, we computed vertical ADCIGs using the method described in the above section (i.e., by replacing horizontal variables x and hx with vertical variables z and hz). The vertical ADCIG shown in the lower panels have a slightly better spatial localization of energy. Note that migrated energy in panel d) focuses about 90, which is the forward-scattered equivalent of a zero-offset reflection. Also imaged is a cross-hair pattern about the target zone in panel c) that is directly analogous to smearing commonly observed in tomographic images that derives from limited ray coverage.
The migration results for forward-scattered P-S conversions are
shown in Figure ![[*]](http://sepwww.stanford.edu/latex2html/cross_ref_motif.gif) . However, we have not yet fully
implemented Equation (19), and use Equation (21)
as a proxy instead. This is not too grievous of an approximation, as
shown by Rosales and Biondi (2005). Hence, angles are not
exactly in the correct position. Future work will implement the
appropriate expressions. The upper panels show the P-S horizontal
ADCIG. Panel b) exhibits clusters of energy on both sides of the
90 mark. These represent groups of 3 plane-waves impinging
from the right and left sides of the model that are mapped to different
sides of the 90 normal axis. Relative to the equivalent panels in
Figure
. However, we have not yet fully
implemented Equation (19), and use Equation (21)
as a proxy instead. This is not too grievous of an approximation, as
shown by Rosales and Biondi (2005). Hence, angles are not
exactly in the correct position. Future work will implement the
appropriate expressions. The upper panels show the P-S horizontal
ADCIG. Panel b) exhibits clusters of energy on both sides of the
90 mark. These represent groups of 3 plane-waves impinging
from the right and left sides of the model that are mapped to different
sides of the 90 normal axis. Relative to the equivalent panels in
Figure ![[*]](http://sepwww.stanford.edu/latex2html/cross_ref_motif.gif) , the forward-scattered horizontal ADCIG indicates
that forward-scattered converted waves afford significantly
higher resolution than P-P diffractions. This observation is a
consequence of the direct link between increased differential arrival
times and improved spatial resolution.
, the forward-scattered horizontal ADCIG indicates
that forward-scattered converted waves afford significantly
higher resolution than P-P diffractions. This observation is a
consequence of the direct link between increased differential arrival
times and improved spatial resolution.
 |
The vertical ADCIG volume, shown in the lower panels, again affords
better resolution of sub-vertical structure than sub-horizontal
interfaces. The zone of short-wavelength structure is better imaged than
its counterpart in Figure ![[*]](http://sepwww.stanford.edu/latex2html/cross_ref_motif.gif) , and has better angle-domain
localization.
, and has better angle-domain
localization.