

Next: Conclusion and Discussion
Up: Wang and Shan: Choosing
Previous: wavefield reconstruction
Now, we show some numerical examples of poststack depth migration results with the SSF operator, in which the reference velocity is chosen with the approach discussed above.
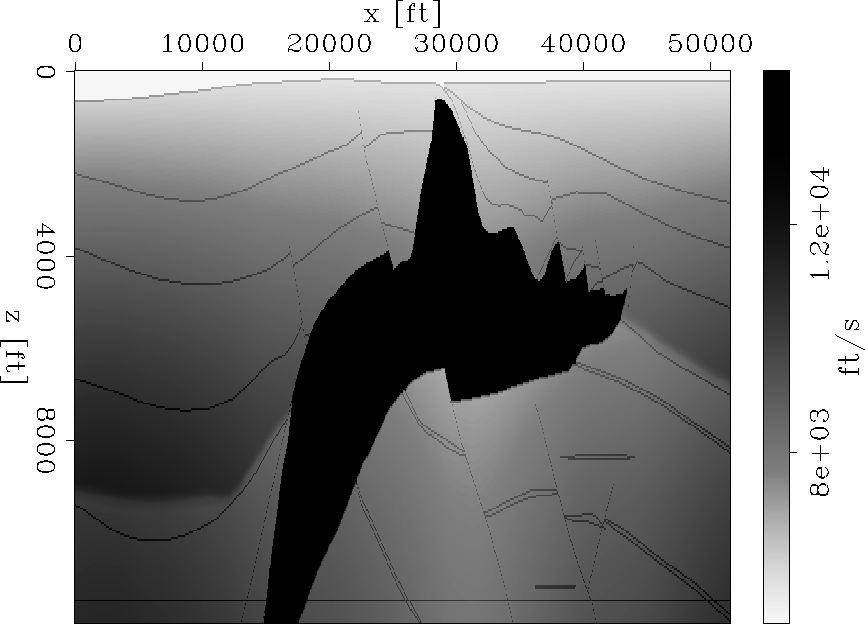
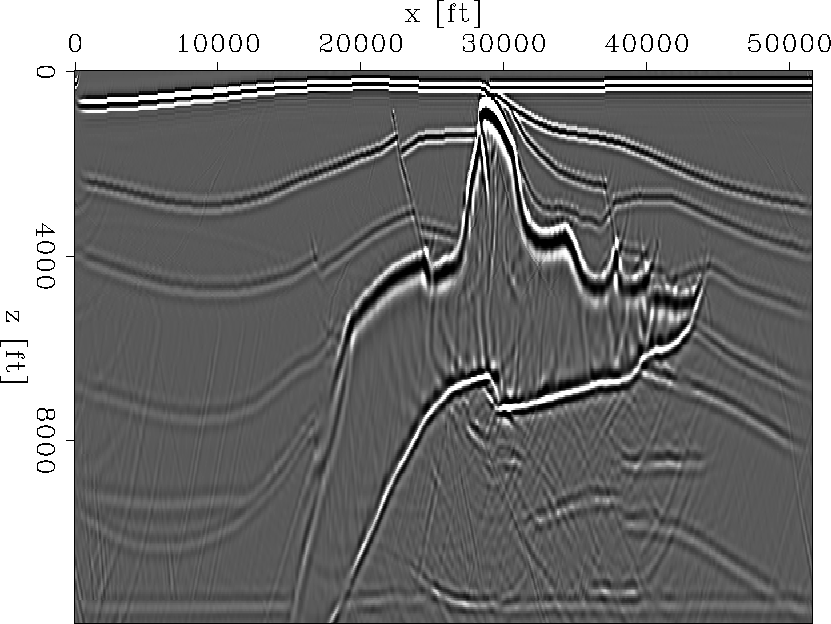
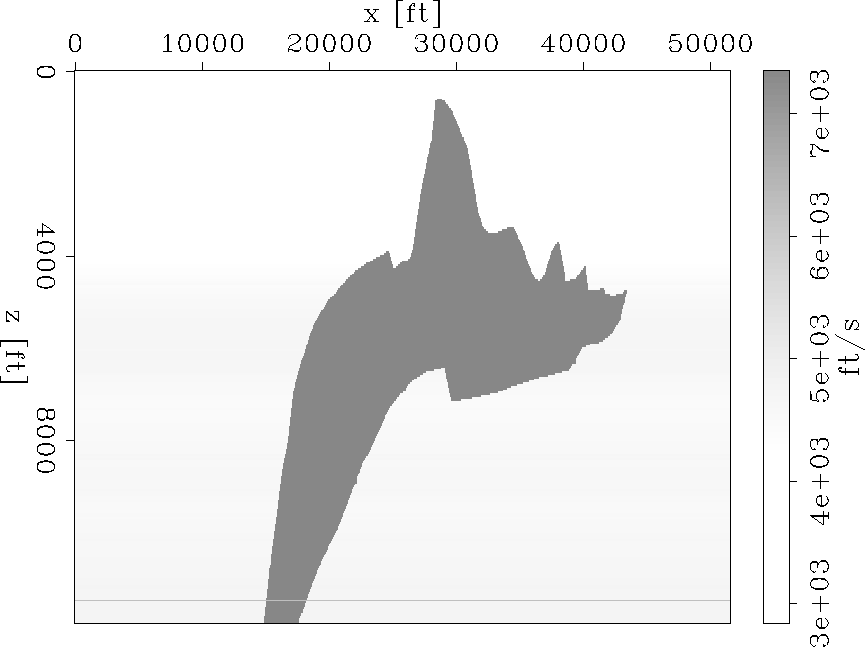
Figure 1 is the 2D SEG/EAGE salt-dome model. Figure 2 shows the imaging result generated with the (SSF) operator with one reference velocity during one extrapolation step. The image is very noisy, especially in the inner part of the salt dome, and the small faults are vague and difficult to identify.
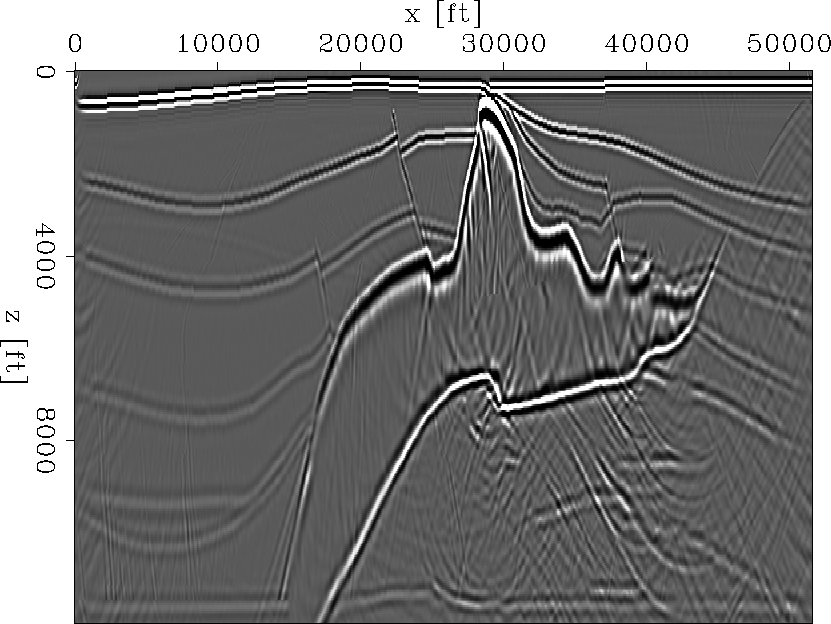
In Figure 4, the reference velocity is chosen with the approach presented above, and the threshold of the ratio between two adjacent velocity steps is set to 1.3. We can see that the imaging noise is greatly attenuated, and the faults and the boundary are quite clear.
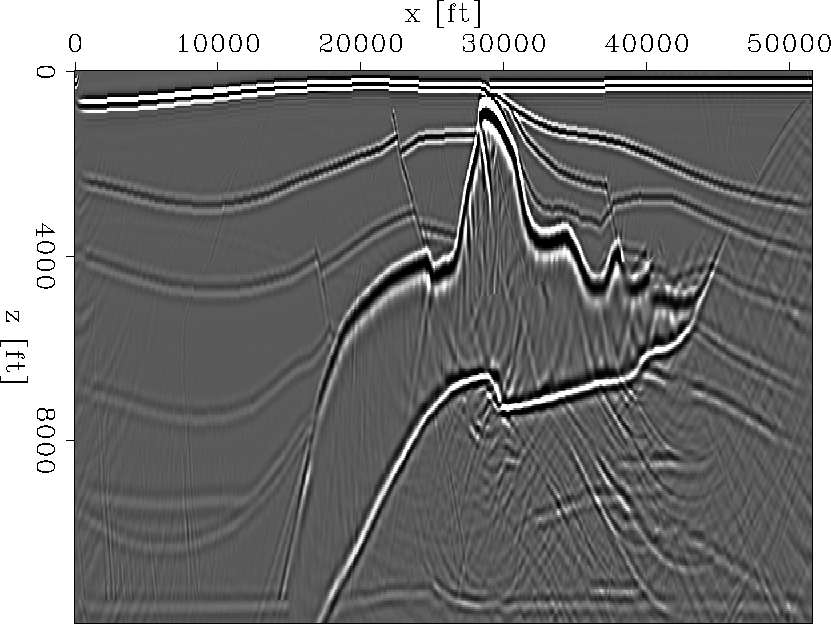
Figure 3 and Figure 5 are similar to Figure 4, but with a threshold of 1.5 and 1.1. In Figure 5, the imaging quality is improved further, but the improvement is not sufficient to justify the increased number of reference velocities. In Figure 3, the imaging quality is not decreased obviously, which means that it is not necessary for the number of reference velocities to be too much. The reason why the noise appears on the right part of these images does not figure out. It remains a problem.
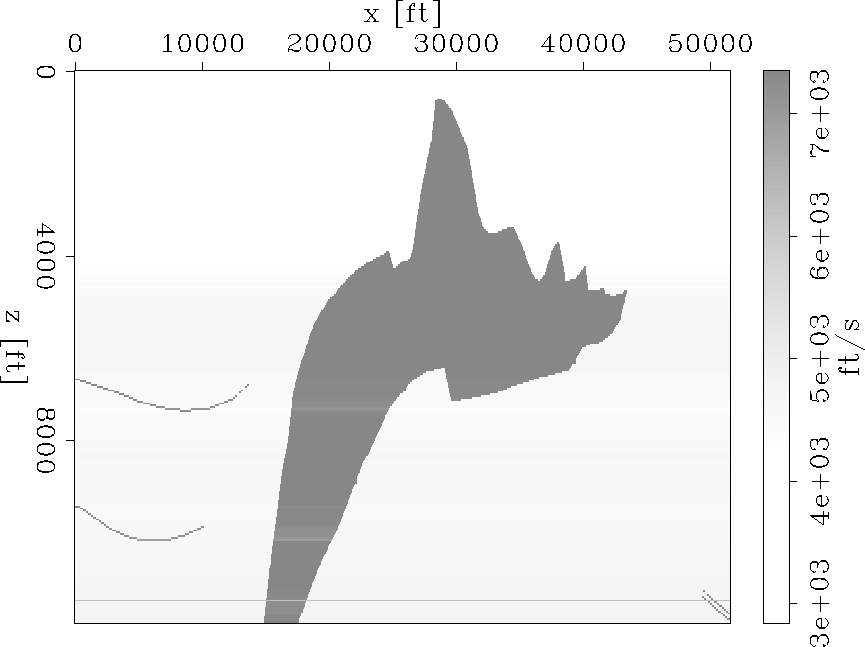
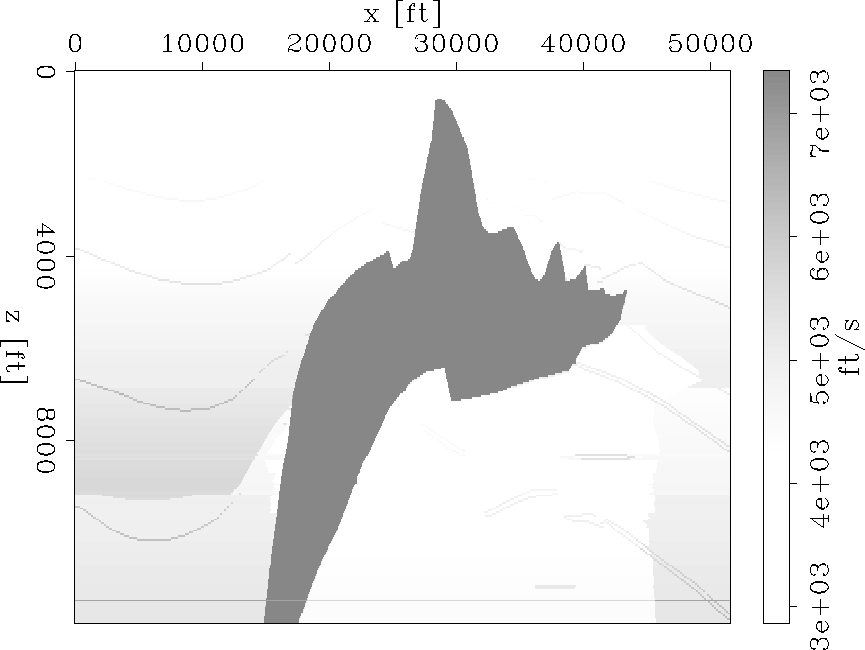
The chosen reference velocity field, with the threshold set to 1.5, 1.3 and 1.1, is shown in Figure 6, 7, and 8, respectively. This choice satisfactorily characterizes the background variation of the true 2D SEG/EAGE salt-dome velocity model.
salt_model
Figure 1 The 2D SEG/EAGE velocity model for the salt-dome example.


 single_ref_v
Figure 2 The imaging result of 2D poststack depth migration with one reference velocity during an extrapolation step.


 multiple_ref_v1.5
Figure 3 The imaging result of 2D poststack migration with a set of reference velocities during an extrapolation step with a threshold of 1.5.


 multiple_ref_v1.3
Figure 4 The imaging result of 2D poststack migration with a set of reference velocities during an extrapolation step with a threshold of 1.3.


 multiple_ref_v1.1
Figure 5 The imaging result of 2D poststack migration with a set of reference velocities during an extrapolation step with a threshold of 1.1.


 reference_v1.5
Figure 6 The chosen reference velocity field with a threshold of 1.5 which satisfactorily characterizes the background variation of the true 2D SEG/EAGE salt-dome velocity model.


 reference_v1.3
Figure 7 The chosen reference velocity field with a threshold of 1.3 which satisfactorily characterizes the background variation of the true 2D SEG/EAGE salt-dome velocity model.


 reference_v1.1
Figure 8 The chosen reference velocity field with a threshold of 1.1 which satisfactorily characterizes the background variation of the true 2D SEG/EAGE salt-dome velocity model.


Next: Conclusion and Discussion
Up: Wang and Shan: Choosing
Previous: wavefield reconstruction
Stanford Exploration Project
5/3/2005
