Next: Conclusion
Up: Shan and Biondi: Steeply
Previous: Anisotropic plane-wave migration in
We test our method on a synthetic dataset and compare the results of isotropic and anisotropic migration.
Figure ![[*]](http://sepwww.stanford.edu/latex2html/cross_ref_motif.gif) shows the model of the synthetic data we use to test our method. Figure (a) is the density model,
Figure (b) is the vertical P-wave velocity model, and Figure (c) is the map of the anisotropy
parameter
shows the model of the synthetic data we use to test our method. Figure (a) is the density model,
Figure (b) is the vertical P-wave velocity model, and Figure (c) is the map of the anisotropy
parameter  . The anisotropy parameter
  is for this dataset. The salt flank is very steep, and
its top part over hangs. In the sediments, the vertical P-velocity increases gradually with the depth.
One sediment layer (between 2000 m and 3000 m) is strongly anisotropic. Our aim is to image the flank of the salt dome and the sediment reflector below the anisotropic layer and
near the salt dome accurately.
Figure shows a near-offset section of the synthetic data.
Notice the strong energy reflected from the salt flank in the near offset data.
is for this dataset. The salt flank is very steep, and
its top part over hangs. In the sediments, the vertical P-velocity increases gradually with the depth.
One sediment layer (between 2000 m and 3000 m) is strongly anisotropic. Our aim is to image the flank of the salt dome and the sediment reflector below the anisotropic layer and
near the salt dome accurately.
Figure shows a near-offset section of the synthetic data.
Notice the strong energy reflected from the salt flank in the near offset data.
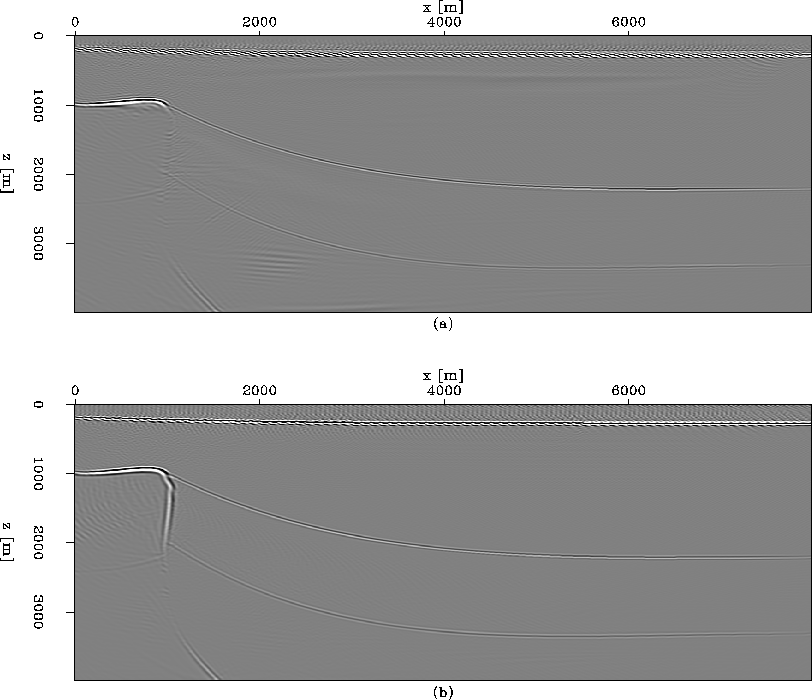
Figure shows the results of the isotropic migration for this dataset. Figure (a) is the result of the
isotropic plane-wave migration in Cartesian coordinates, and
Figure (b) is the result of the isotropic plane-wave migration in tilted coordinates.
In Figure (a), the salt flank is totally lost. This is because
waves related to the salt flank are overturned, and the one-way wave-equation downward continuation method can not extrapolate
them correctly. In Figure (b), although a weak steeply dipping reflector can be seen,
it is not at the correct position, because the anisotropy in the sediment layer was neglected.
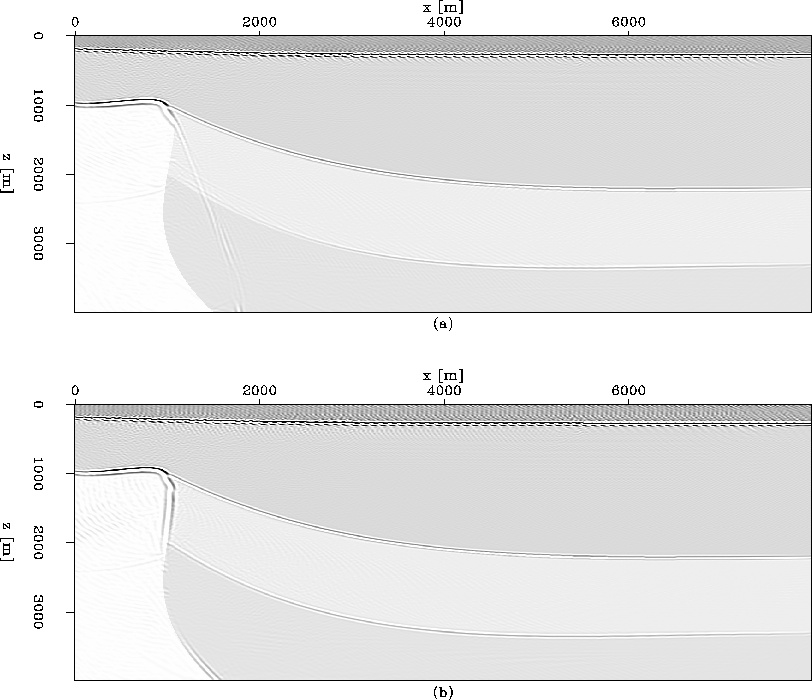
Figure shows the results of the anisotropic migration for this dataset.
Figure (a) is the anisotropic plane-wave migration in
Cartesian coordinates, and Figure (b) is the anisotropic plane-wave migration in tilted coordinates.
In Figure (a), the top part of the salt flank is lost due to overturned waves, but the bottom part of the salt flank is
correctly imaged, but is not focused by the isotropic migration (Figures (a) and (b)). In Figure (b),
the image is greatly improved compared to the previous three images. Both the top and bottom parts of the salt flank are well imaged.
In Figure (b), the reflector below the anisotropic layer is stronger and more continuous near the salt flank compared to that in the isotropic migration result.
To check if the reflectors are imaged at the correct positions, we
overlay the images with the density model in Figure .
Figure (a) is
the isotropic migration result overlaid with the density model. Figure (b) is
the anisotropic migration result overlaid with the density model.
The salt flank matches the density model very well in the image obtained
by the anisotropic migration, while it deviates from the model in the isotropic one.
The flat part of the reflector below the anisotropic layer is not affected much by the anisotropy.
Both the isotropic and anisotropic migration image it at the correction position.
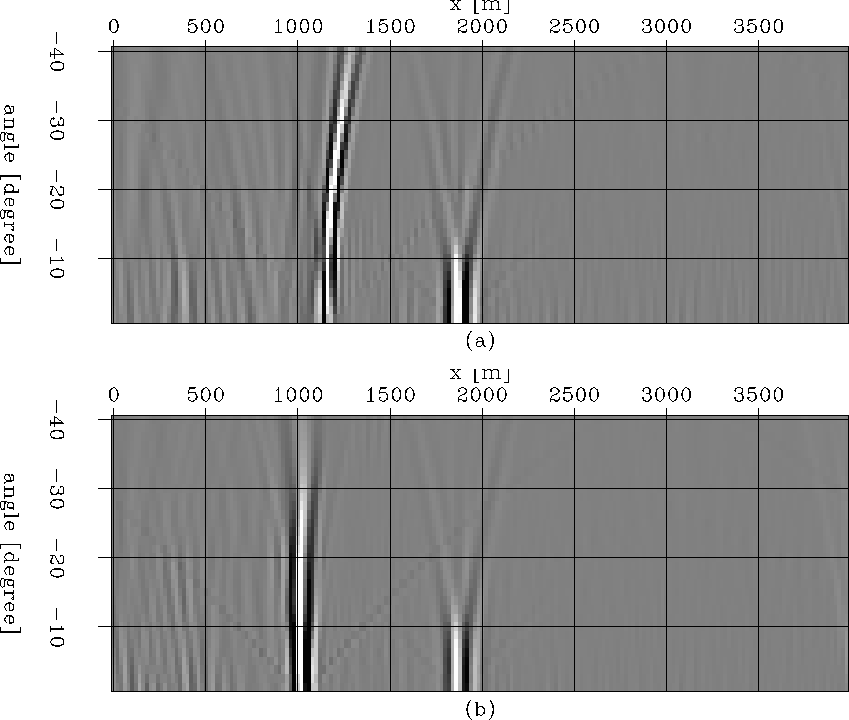
Figure shows the horizontal angle-domain CIGs at the horizontal location x=4000m.
Figure (a) is obtained by the isotropic migration, and
Figure (b) is obtained by the anisotropic migration.
Figure shows the vertical angle-domain CIGs at the vertical location z=1500m.
Figure (a) is obtained by the isotropic migration, and
Figure (b) is obtained by the anisotropic migration.
Although we use the true, vertical P-wave velocity in the isotropic migration,
we find a small curvature in the horizontal angle gathers at the reflector below the anisotropic layer (at z=3300 m in Figure ), and
a big curvature in the vertical angle gathers at the salt flank (x between 1000 m and 1500 m in Figure ).
In the anisotropic migration, the angle gathers are flat at these locations.
The big curvature of the angle gathers at the steeply dipping reflectors
can be used as a tool to estimate the error in the anisotropy parameters used in the migrations.
iso
Figure 4 Isotropic plane-wave migration results: (a) in Cartesian coordinates; (b) in tilted coordinates.


 ani
ani
Figure 5 Anisotropic plane-wave migration results: (a) in Cartesian coordinates; (b) in tilted coordinates.
isoanidn
Figure 6 Migration results overlaid with density model: (a) isotropic migration; (b) anisotropic migration.
ang4000
Figure 7 Horizontal angle-domain CIGs at x=4000m: (a) isotropic migration; (b) anisotropic migration.
ang1500
Figure 8 Vertical angle-domain CIGs at z=1500m: (a) isotropic migration; (b) anisotropic migration.
Next: Conclusion
Up: Shan and Biondi: Steeply
Previous: Anisotropic plane-wave migration in
Stanford Exploration Project
5/3/2005