

Next: Fréchet derivative integral kernels
Up: Wave-equation migration velocity analysis
Previous: Linearized image perturbations
Depth imaging of complex structures
depends on the quality of the velocity model.
However, conventional Migration Velocity Analysis (MVA)
procedures often fail when
the wavefield is severely distorted by lateral
velocity variations and thus complex multipathing occurs.
In the preceding sections, I introduce a method of
migration velocity analysis using wave-equation techniques
(WEMVA), which aims
to improve the quality of migrated images, mainly by
correcting moveout inaccuracies of specular energy.
WEMVA finds a slowness perturbation which corresponds to an
image perturbation.
It is thus similar to ray-based migration tomography
(104; 14; 3; 33; 55),
where the slowness perturbation is
derived from depth errors, and to
wave-equation inversion (108)
or tomography
(114; 28; 72)
where the slowness perturbation is
derived from measured wavefield perturbations.
WEMVA has the potential of improving velocity estimation
when complex wave propagation
makes conventional ray-based MVA methods less reliable.
Imaging under rugged salt bodies
is an important case
where WEMVA has the potential of making a difference
in the imaging results.
Here, I analyze the characteristics of the
tomographic operator inverted in WEMVA to update the velocity model,
and contrast these characteristics with the well-known
characteristics of ray-based tomographic operators.
One way of characterizing integral operators, e.g.
tomography operators, is through sensitivity kernels, which
describe the sensitivity of a component of a member
of the data space to a change of a component of a
member of the model space.
In this section, I formally introduce the sensitivity kernels for
wave-equation migration velocity analysis and show
2D and 3D examples.
The analysis of WEMVA sensitivity kernels provides an intuition
on WEMVA's potential for overcoming limitations of ray-based MVA.
Some of these limitations are intrinsic,
other are practical.
An important practical difficulty encountered when
using rays to estimate
velocity below salt bodies with rough boundaries
is the instability of ray tracing.
Rough salt topographies create
poorly illuminated areas, or even shadow zones, in
the subsalt region.
The spatial distribution of
these poorly illuminated areas is very sensitive
to the velocity function.
Therefore,
it is often extremely difficult to trace the rays
that connect a given point in the poorly
illuminated areas with a given point at the surface
(two-point ray-tracing).
Wavefield-extrapolation methods are robust
with respect to shadow zones and they always provide
wavepaths (i.e. sensitivity kernels) usable for velocity inversion.
Ray-tracing has intrinsic limitations when modeling
wave-propagation through salt bodies with complex geometry,
because of the asymptotic assumption on which it is based.
This intrinsic limitation prevent ray-tracing from
modeling the frequency-dependency of full-bandwidth wave propagation.
The comparison of sensitivity kernels computed assuming different
frequency bandwidths
illustrates clearly the drawbacks of the asymptotic assumptions.
Top-salt rugosity causes the WEMVA sensitivity kernels to be
strongly dependent on the bandwidth.
Furthermore, in these conditions, sensitivity kernels are
drastically different from simple ``fat rays''.
Therefore, they cannot be approximated by kernels computed
by a bandwidth-dependent fattening of geometric rays
(57).
I compute the sensitivity kernels for perturbations in the phase
as well as perturbations in the amplitude.
It is interesting to notice that the 3D kernels for phase perturbations
are hollow in the middle, exactly where the geometric rays would be.
This result is consistent with the observations
first made by (113);
then extensively discussed in the
global seismology community
(28; 58),
and further analyzed by
(76).
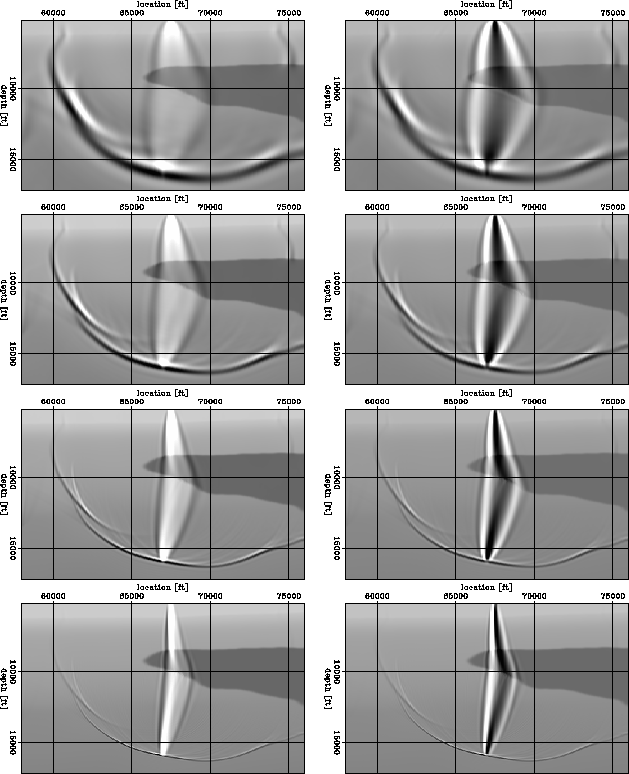
fat2d.Tray2a
Figure 10 The dependence of sensitivity kernels to frequency and image perturbation.
From top to bottom, the frequency range is
1-4 Hz, 1-8 Hz, 1-16 Hz and 1-32 Hz.
The left column corresponds to kinematic image perturbations,
and the right column corresponds to dynamic image perturbations.
The wavefield is produced from a point source.
![[*]](http://sepwww.stanford.edu/latex2html/movie.gif)


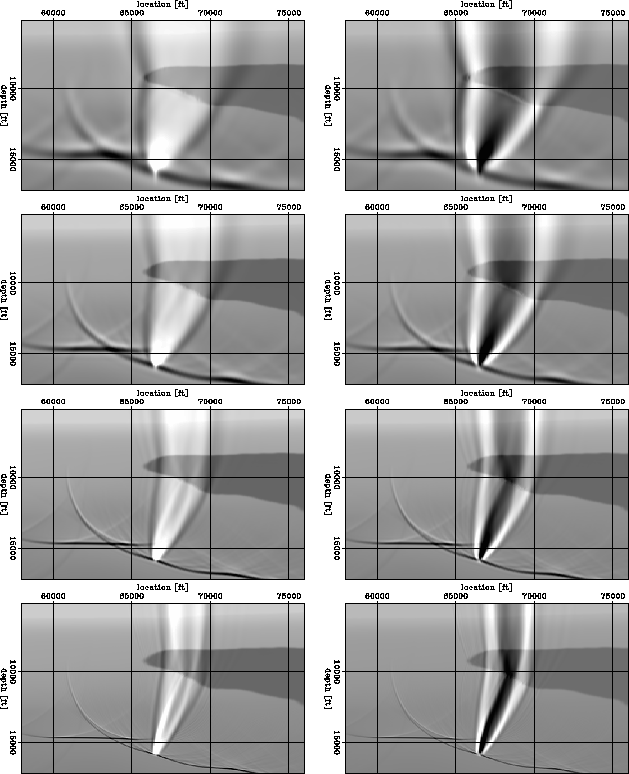
 fat2d.Tray2b
Figure 11 The dependence of sensitivity kernels to frequency and image perturbation.
From top to bottom, the frequency range is
1-4 Hz, 1-8 Hz, 1-16 Hz and 1-32 Hz.
The left column corresponds to kinematic image perturbations,
and the right column corresponds to dynamic image perturbations.
The wavefield is produced by a horizontal incident plane-wave.
![[*]](http://sepwww.stanford.edu/latex2html/movie.gif)


![[*]](http://sepwww.stanford.edu/latex2html/movie.gif)
