

Next: TOMOGRAPHY
Up: Clapp and Wilson: The
Previous: INTRODUCTION
The data is from an array laid out across
the Colorado-Wyoming border. The array is composed of 30 seismometers
laid out in line in a semi-straight line with
approximate spacing of 2.6 km.
The data consists of a series of arrival times
from known station locations, at known dips and
arrival directions (back azimuths).
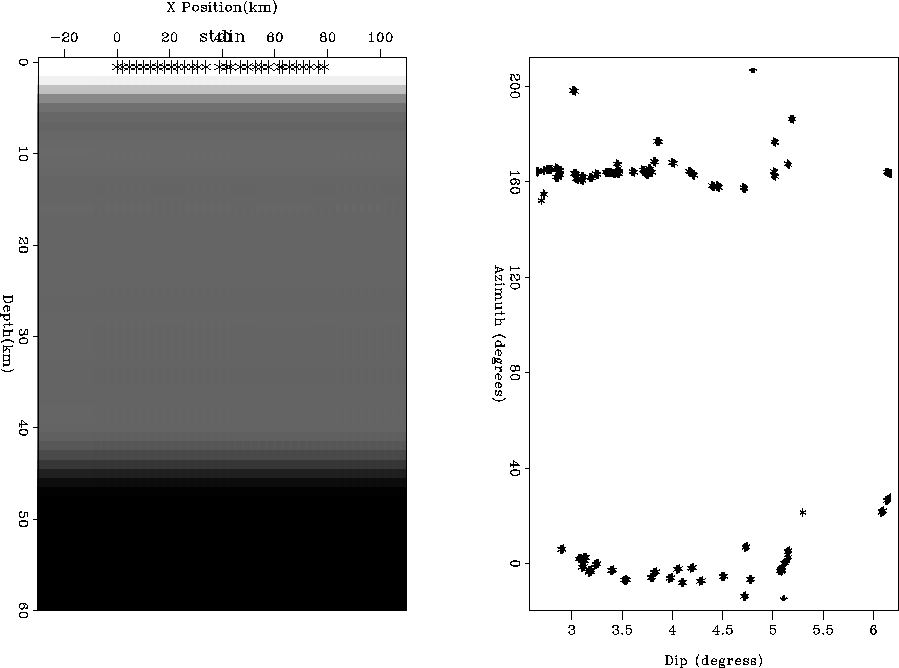
The left panel
of Figure ![[*]](http://sepwww.stanford.edu/latex2html/cross_ref_motif.gif) shows an initial velocity model
with the stations marked with an `*'. The right
panel of Figure
shows an initial velocity model
with the stations marked with an `*'. The right
panel of Figure ![[*]](http://sepwww.stanford.edu/latex2html/cross_ref_motif.gif) shows the
distribution, in terms of azimuth and angle,
of the earthquakes used in this experiment.
initial
shows the
distribution, in terms of azimuth and angle,
of the earthquakes used in this experiment.
initial
Figure 1 The left panel
shows an initial velocity model
with the recording stations marked with an `*'. The right
panel shows the
distribution, in terms of azimuth (compared
to receiver line) and dip,
of the earthquakes used in this experiment. The large change at 43 km is
the Moho.
![[*]](http://sepwww.stanford.edu/latex2html/movie.gif)


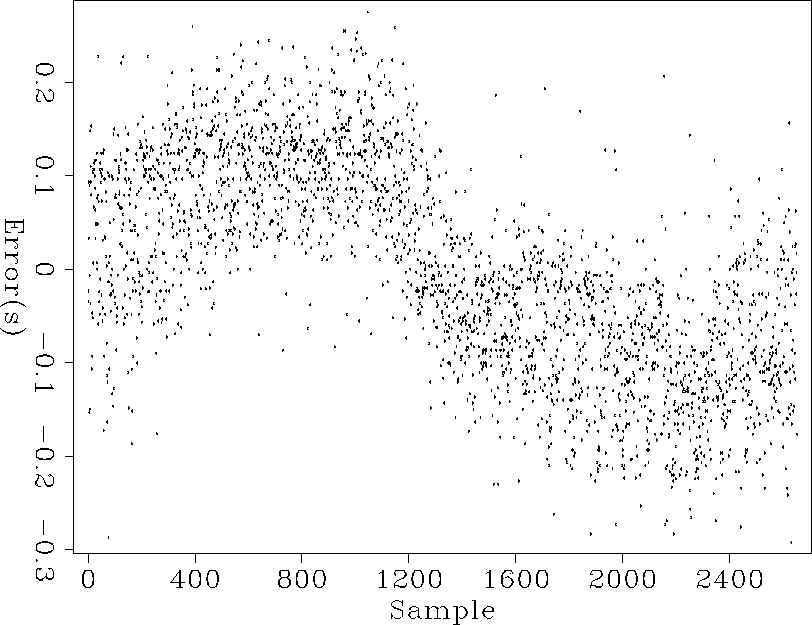
A linear trend is removed from the arrival times
for each event (earthquake). The subtraction
of the trend is meant to account for the
varying source directions (earthquake position
compared to the array).
The trend removed arrived times generally form
the data  for the global tomography problem.
Figure
 ![[*]](http://sepwww.stanford.edu/latex2html/cross_ref_motif.gif) shows these arrivals with
the trend removed. Note the general
shapein the times.
shows these arrivals with
the trend removed. Note the general
shapein the times.
dt
Figure 2 The arrival times
with a linear trend removed. Note the pattern
in the arrival times.
|
|  |


Next: TOMOGRAPHY
Up: Clapp and Wilson: The
Previous: INTRODUCTION
Stanford Exploration Project
10/23/2004

![[*]](http://sepwww.stanford.edu/latex2html/movie.gif)
![[*]](http://sepwww.stanford.edu/latex2html/cross_ref_motif.gif) shows an initial velocity model
with the stations marked with an `*'. The right
panel of Figure
shows an initial velocity model
with the stations marked with an `*'. The right
panel of Figure 