In order to characterize both the direct field and the Lorentz
field, we conducted a series of experiments involving the recording of
various sources with electrode pairs deployed in a circular geometry. The
electrode array was spaced evenly around a circle of radius 4.3m in a
homogeneous part of the vineyard meadow, with 12 electrode pairs
oriented radially and 12 oriented tangentially. Thus tangential and
radial pairs of electrodes were co-located at 30 degree intervals
around the circle. The source point is in the center of the circle
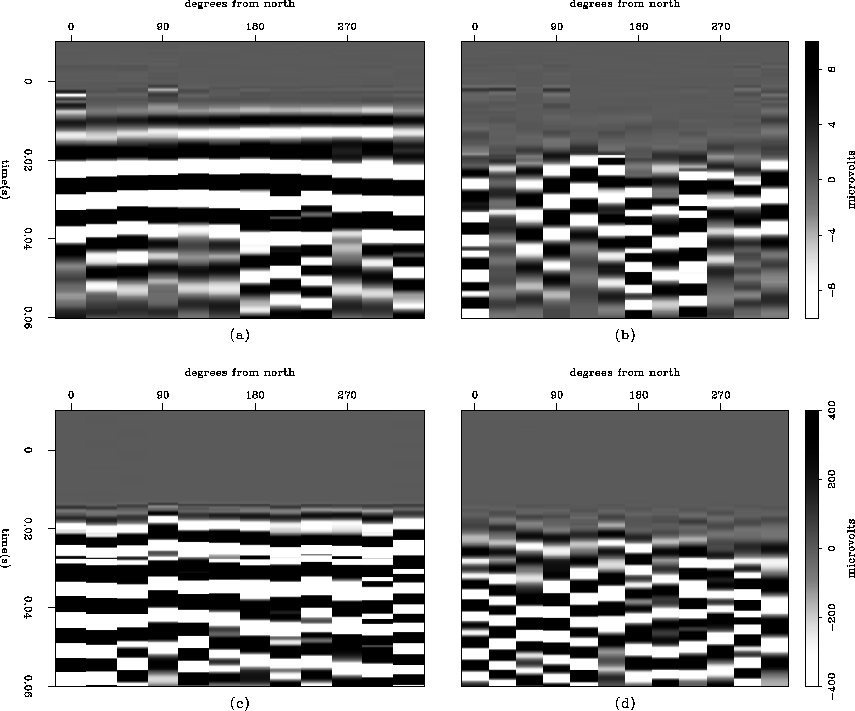
for all shot gathers. Figure 4a shows the radial
traces of a shot gather
collected with a sledgehammer striking the plastic plate. Based on
arrival times from the data shown in Figure 2, we
can interpret the strong coherent arrival at 0.02 seconds as the
coseismic energy, and the weaker arrival at 0.01 seconds as the direct
field. These arrivals do not appear in the tangential part of the
same shot gather (Figure 4b), as is to be expected for
a vertical dipole (the direct field) and radially propagating seismic
energy (the coseismic arrival). Further confirmation of our
interpretation of the 0.02 second arrival as coseismic energy is
provided by the corresponding radial horizontal geophone data shown in
Figure 4c, where we see that the first seismic arrival
closely matches the interpreted coseismic arrival in Figure
4b. The lack of any energy at ![]() 0.01 seconds in Figure
4c supports our interpretation of the 0.01 second
energy in Figure 4a as the direct field, or at least as
an electroseismic arrival. As is to be expected, the tangential
geophone data (Figure 4d) do not show coherent
arrivals.
0.01 seconds in Figure
4c supports our interpretation of the 0.01 second
energy in Figure 4a as the direct field, or at least as
an electroseismic arrival. As is to be expected, the tangential
geophone data (Figure 4d) do not show coherent
arrivals.
 |
![[*]](http://sepwww.stanford.edu/latex2html/movie.gif)
The fact that the direct field energy in Figure 4a
shows (approximately) constant amplitudes around the circle is
consistent with the interpretation that this energy is due to a
vertical dipole. The deviations from constant amplitude are likely
caused by imperfect electrode coupling. We can constrain the size and
location of this dipole by considering the amplitude pattern of the
in-line shot record shown in Figure 2c. Figure
5a shows the same data, but with a lower-frequency
bandpass filter (so as to better represent the full direct field,
which can be clearly seen as a single strong arrival at ![]() 0.005
seconds). The amplitude of the maximum of this arrival is plotted as
dots in Figure 5b. Using the equation for the
amplitude pattern of a dipole
0.005
seconds). The amplitude of the maximum of this arrival is plotted as
dots in Figure 5b. Using the equation for the
amplitude pattern of a dipole
| |
(4) |
(where q is the charge and d is the separation between poles) we
model amplitudes corresponding with
a disk of dipoles with radius 0.8m and located at a distance of 0.8m
from the electrode receiver line, plotted as a solid line in Figure
5b. The fit of this model to the data broadly indicates
that the direct field is produced within a volume of earth of
radius ![]() 0.8m. The absolute magnitude of the modeled dipole is entirely
arbitrary; it is simply scaled to match the real data. The numerous
variables that contribute to the real magnitude are too complex to
permit exact modeling.
0.8m. The absolute magnitude of the modeled dipole is entirely
arbitrary; it is simply scaled to match the real data. The numerous
variables that contribute to the real magnitude are too complex to
permit exact modeling.
 |