

Next: Conclusions
Up: Examples
Previous: Delineation of rough salt
Our next example concerns a zero-offset GPR dataset over a lava flow region.
In this situation, diffraction focusing is the only option available
for migration velocity analysis.
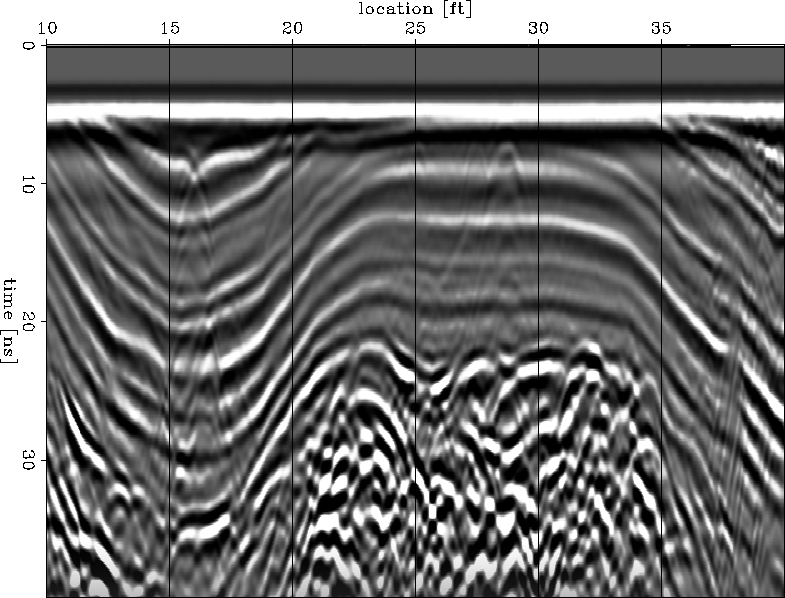
The data depicted in Figure 11 show many diffractions
spread over the entire dataset. A few obvious ones are
at x=22 ft, t=27 ns,
at x=28 ft, t=22 ns, and
at x=35 ft, t=23 ns.
LAVAdata
Figure 11
Zero-offset GPR data used for focusing migration
velocity analysis.

We follow the same procedure for migration velocity analysis as the one
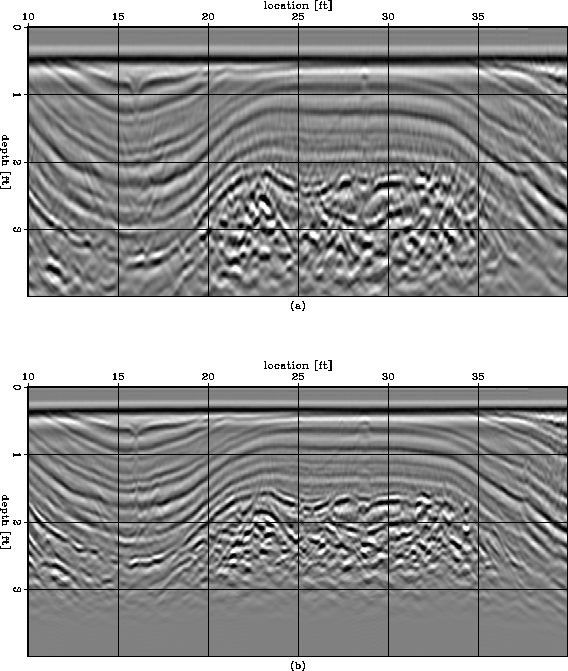
described for the preceding example. Figure 12(a) shows the initial
image obtained by migration with a constant velocity of 0.2 ft/ns, and
Figure 12(b) shows the final image obtained after velocity update.
We can notice that the image has been vertically compressed, since the
velocity update indicated a faster velocity, and most of the diffractions
have been collapsed.
LAVAimag
Figure 12 Zero-offset migrated images for the data in
Figure 11 using the initial velocity (a)
and the updated velocity (b).
![[*]](http://sepwww.stanford.edu/latex2html/movie.gif)

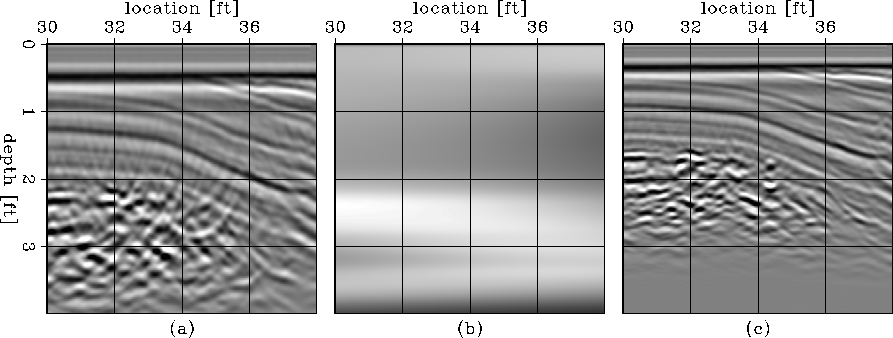
Figures 13 and 14 are detailed views
of the initial and final images and slownesses at various locations
of interest.
Figure 13 shows collapsed diffractions in the left part of the image.
We can also observe features with better continuity in the updated image
than in the original image,
for example at x=20-24 ft and z=2 ft in Figure 13(a,c).
Likewise, Figure 14 shows a better focused image than in the
original, for example at x=34 ft and z=1.8 ft in Figure 14(a,c).
LAVAyoom
Figure 13
Detail of the images depicted in Figure 12.
Migration with the initial velocity (a),
updated slowness model (b) and
migration with the updated slowness (c).
The window corresponds to x=20-24 ft and z=2 ft.
![[*]](http://sepwww.stanford.edu/latex2html/movie.gif)
 LAVAzoom
Figure 14
Detail of the images depicted in Figure 12.
Migration with the initial velocity (a),
updated slowness model (b) and
migration with the updated slowness (c).
The window corresponds to x=34 ft and z=1.8 ft
![[*]](http://sepwww.stanford.edu/latex2html/movie.gif)


Next: Conclusions
Up: Examples
Previous: Delineation of rough salt
Stanford Exploration Project
5/23/2004


![[*]](http://sepwww.stanford.edu/latex2html/movie.gif)

![[*]](http://sepwww.stanford.edu/latex2html/movie.gif)

![[*]](http://sepwww.stanford.edu/latex2html/movie.gif)