The previous two sections show that the separate procedure of calibration and data combination provides better results than just calibrating and combining the data in one step. However, to verify whether we have effectively eliminated some multiples, we perform a poststack migration on the data and compare the results before and after the combination.
Wolf et al. (2004) propose a methodology that calculates stacking velocities without picking through a robust median estimator manufactured from neighboring traces only. The methodology depends on the estimation of the local step out; therefore, its accuracy strongly depends on the estimation of the dip field. Finally, the local estimate of the RMS velocity is:
| (10) |
 |
|
upslow
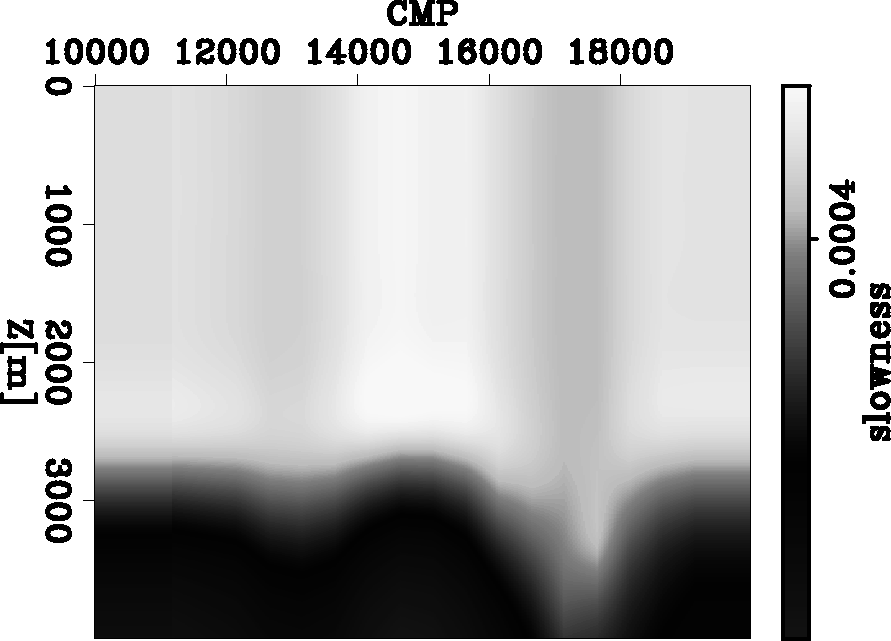
Figure 10 Initial P slowness model. |  |
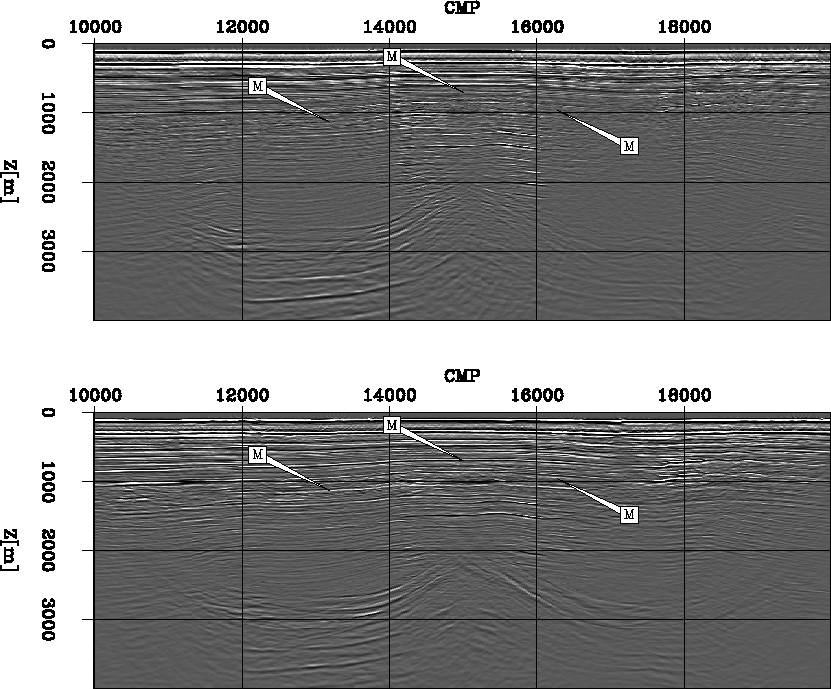
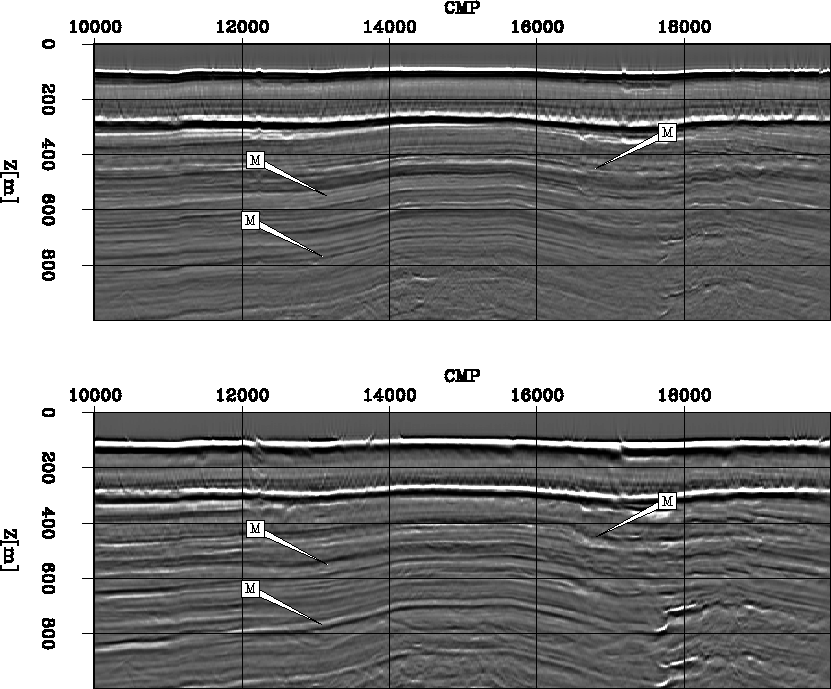
Figure 11 presents the first 4000 m of the migrated seismic line. The top part shows the result of the combination and the bottom part shows the geophone component alone. In the same way, Figure 12 exhibits a close-up view of the migration result.
Several multiples have been attenuated; as indicated by the arrows in both Figures 11 and 12. This is an encouraging result; it reflects that our method produces a reasonable result. However, some multiples are still present in our final result. For example, notice the strong event that follows the water bottom reflection. Note that the water bottom can be considered flat, at a constant depth of approximately 118 m.
 |
![[*]](http://sepwww.stanford.edu/latex2html/movie.gif)
 |
![[*]](http://sepwww.stanford.edu/latex2html/movie.gif)
These multiples correspond to the source ghost. Further multiple-attenuation processes should be performed. For example, a wave-equation based multiple reduction technique can easily remove the source ghosts, since the water bottom is almost flat. This is a technique we have yet to test on this data set.