

Next: Application to Data Recorded
Up: Wilson et al.: Teleseismic
Previous: Why shot-profile migration?
In this section we show the results of migration of modes 2 through 4
from table 1. The synthetic data consists of 16 plane waves at angles of incidence between  and
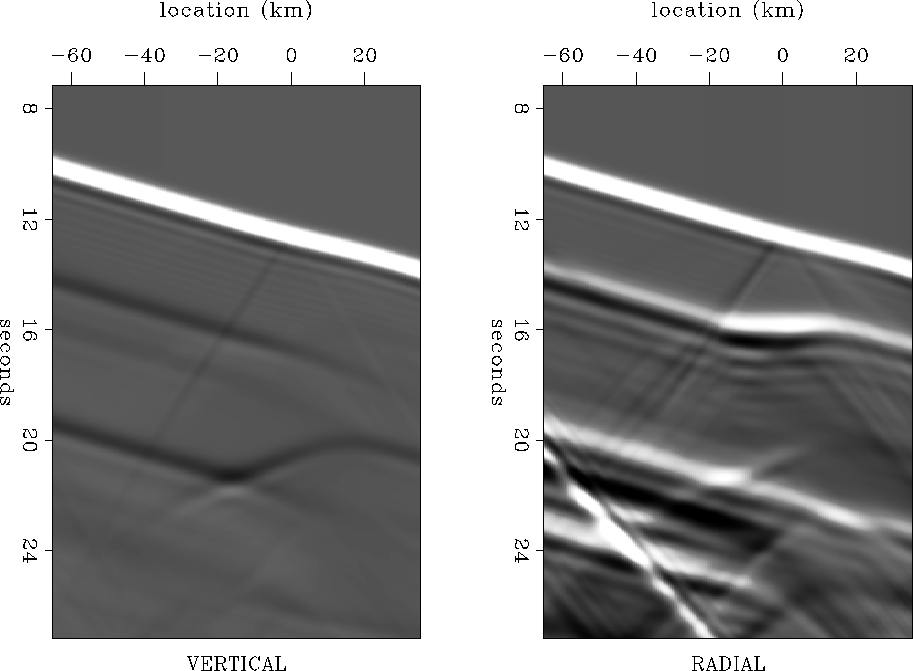
and  propagated through two crustal models: one containing an 8 km offset in the Moho near 30 km depth and another containing a dipping Moho (Figure 3). Figure 2 and Figure 4 show vertical and radial seismograms from the offset and dipping Moho models, respectively. Notice the clear diffracted arrival generated by the Moho offset in Figure 2 that are not present in Figure 4. Also, interesting is the focusing that occurs at the ramp due to the apparent increase of incidence angle due to the structural dip. Contamination from side reflections later in time prohibits our ability to use some later arriving backscattered phases.
Vmod
Figure 3 Velocity models used to generate finite-difference synthetic seismograms.
 dipSYNTH
Figure 4 Synthetic seismograms calculated for a crustal model with a dipping Moho.

We use a receiver spacing of 0.5 km to represent a densely sampled teleseismic experiment. In practice, this sampling is impractical but is necessary here to concentrate on the limitations of the procedure without adding complexity due to wavefield aliasing. Stacked images from individual modes and all modes are shown in the next sections.
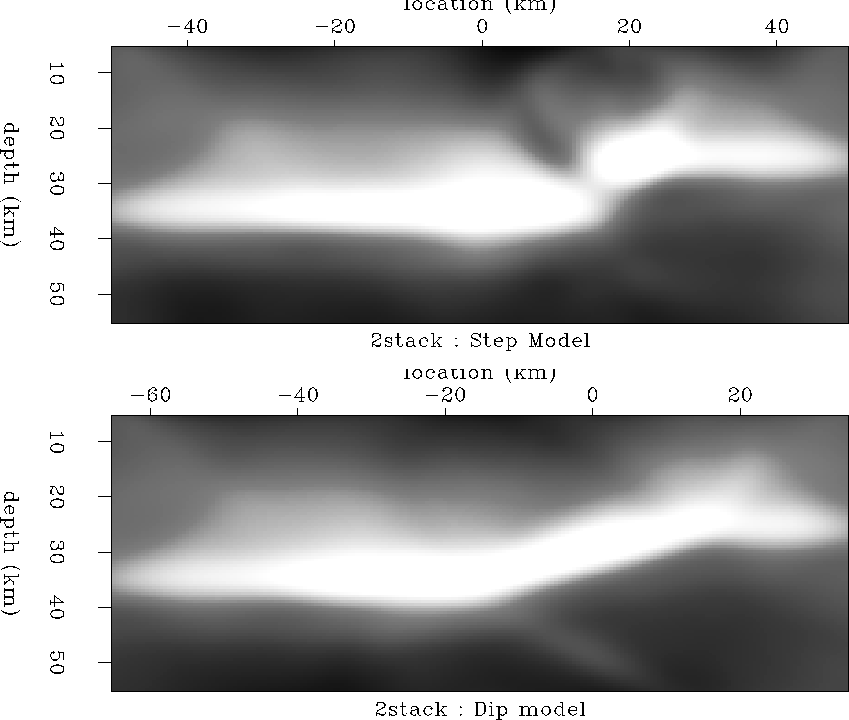
Figure 5 shows the images created with the forward-scattered P-to-S phase for both synthetic models. Both structures are clearly visible although they appear blurred. The low frequency image results from the fact that the wavefields propagate in the same direction and therefore remain correlated over more imaging depths.
2stack
Figure 5 Migrated image of all synthetic events computed using forward-scattered P-to-S waves for the Moho offset model (top) and the and the model with the dipping Moho (bottom).
 3stack
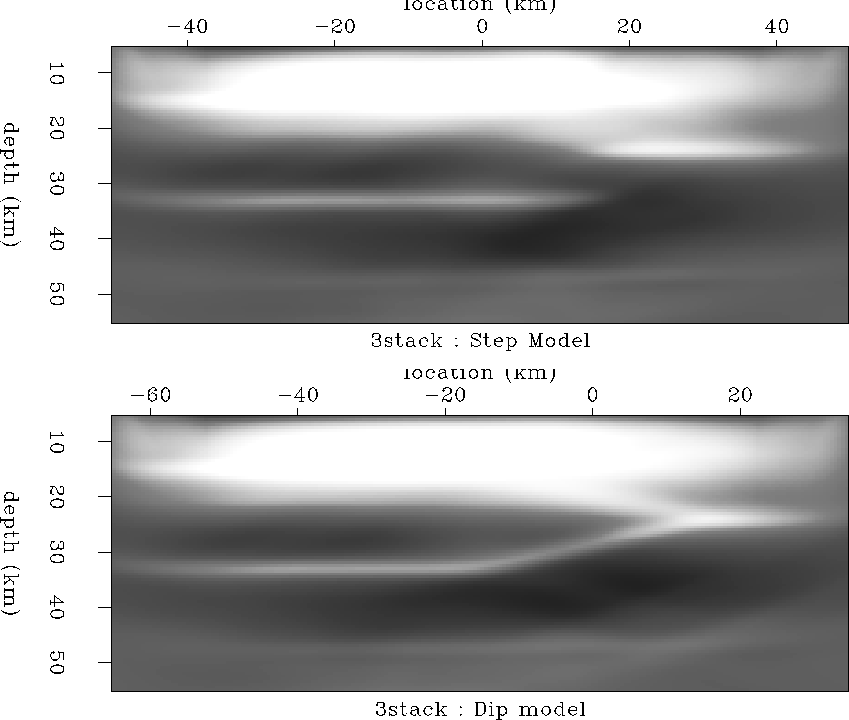
Figure 6 Migrated image of all synthetic events computed using backscattered P-to-P waves for the Moho offset model (top) and the and the model with the dipping Moho (bottom).
 4stack
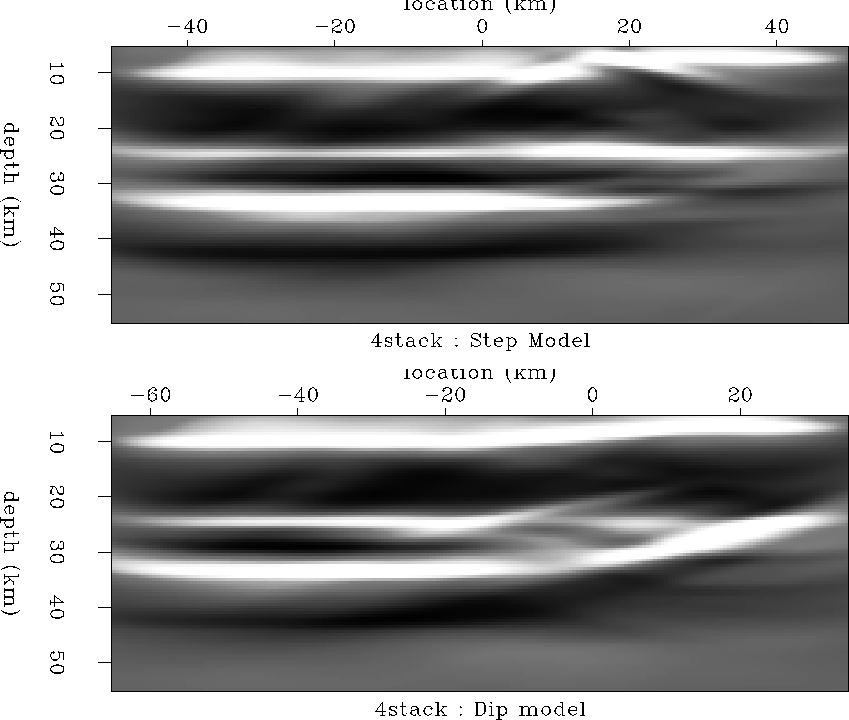
Figure 7 Migrated image of all synthetic events computed using backscattered P-to-S waves for the Moho offset model (top) and the and the model with the dipping Moho (bottom).
 SuperCIG
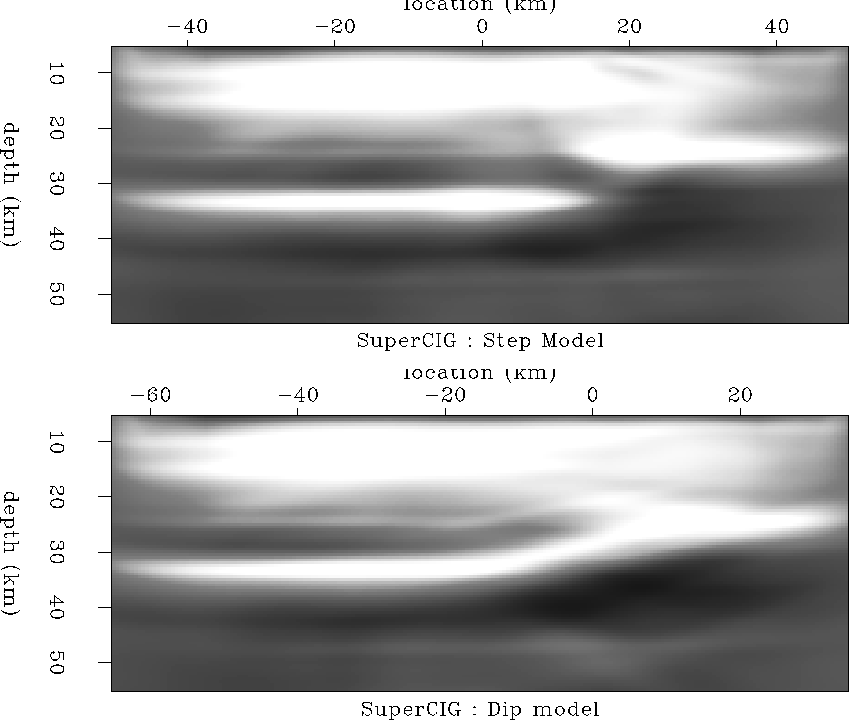
Figure 8 Migrated image of all synthetic events and all modes shown previously for the Moho offset model (top) and the dipping Moho model (bottom).

We show images created with backscattered P-to-P for both synthetic models in Figure 6. Both structures appear better resolved. The high amplitude shallow structure results from erroneously migrated cross-contamination from the forward-scattered P-to-S phase. This indicates cross-contamination may render interpretation of shallow structures difficult. Figure 7 created using backscattered P-to-S conversion also appears heavily contaminated by other phases. This is most apparent in the Moho offset synthetic model (top panel) where the Moho appears to stretch completely across the image. Combining all images reduces the contamination from other phases and sharpens the real crustal features. However, a significant shallow artifact still remains in both images.


Next: Application to Data Recorded
Up: Wilson et al.: Teleseismic
Previous: Why shot-profile migration?
Stanford Exploration Project
5/23/2004


