next up previous print clean
Next: Conclusions and Future Work Up: Curry: Regularizing Madagascar: PEFs Previous: Background

PEFs in the data space

The known data points in the model space are distributed along curved crossing tracks, making it very difficult to estimate a PEF in this space. However, in the data space of the fitting goals in equation (1) of the previous section, the data are sampled in a regular space: a series of regularly-sampled tracks. By transforming the coordinates of the data and model, we can keep the data space regularly-sampled while warping the model space so that a PEF estimated in the data space can be used in the model space.

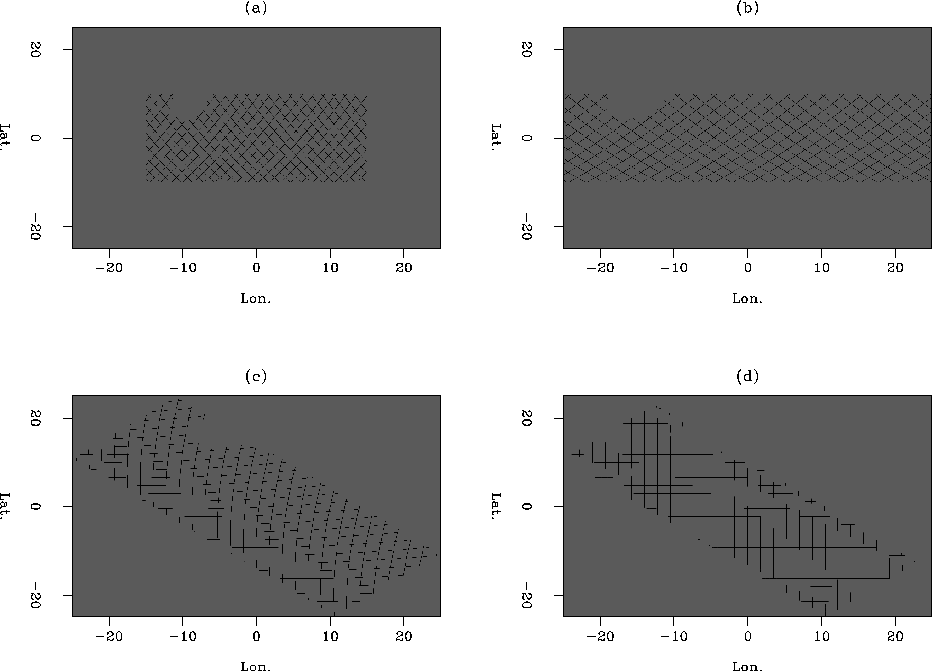
The existing data are collected in a series of ascending and descending crossing tracks. The goal is to transform the model space so that it more closely resembles the pattern in which the data was collected, which is in two sets of crossing tracks. This can be done by first stretching the longitudinal axis so that the tracks are orthogonal, subtracting the mean values of the coordinates of the data, rotating the data so that the tracks are aligned North-South and East-West, applying two parabolic shifts along a rotated axis, and then finally breaking the data up into ascending and descending tracks and griding the data. This process is shown in Figure 3.

 
warping
warping
Figure 3
The steps used in warping the coordinate system.(a): Original model; (b): Stretching and centering; (c): Rotation; (d): Parabolic shifts.
view

The method used to warp the model space is not especially important. It would perhaps be better to use specific coordinates of the data space, but this warping accomplishes the same end goal of having straightened orthogonal tracks. We can use the same warped grid for our model space, allowing us to use a similar methodology that we used for the regularly-sampled data problem. The two sets of orthogonal tracks with missing data is very similar to a problem shown by Claerbout 1999, where a pair of 1D PEFs are used to fill in missing data. This can be expressed as
   \begin{eqnarray}
\bold{K_{data}m} &\approx& \bold{m_{k}} \nonumber \\  \epsilon ...
 ...& \bold 0 \nonumber \\  \epsilon \bold{A_{d}m} &\approx& \bold 0, \end{eqnarray}
(4)
where K, m and m_k are the same as above, and A_a and A_d are 1D PEFs that are estimated on the ascending and descending tracks in the data space, respectively. This approach assumes that the known data is single-valued, and fixes it so that it does not change. The two sets of tracks are reduced to a single map with the fitting goals in equation (1), with $\epsilon$ set to . This becomes the data, and the obtained model is shown in Figure 4.

 
warpfill1
warpfill1
Figure 4
Results in a warped space using the fitting goals in equation (4). Above: model obtained after 500 iterations. Below: residual.
[*] view

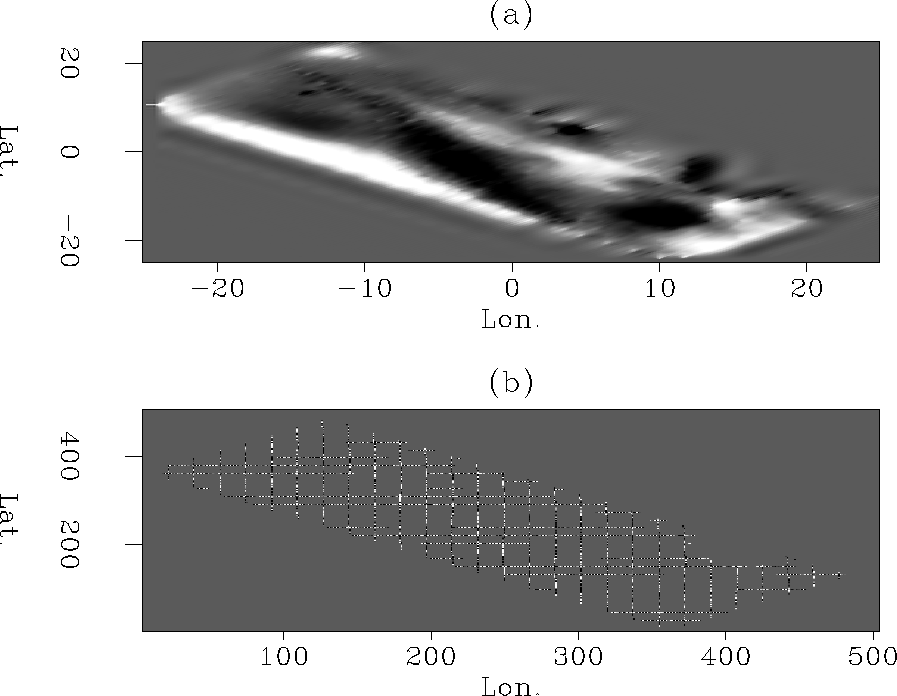
The results of this approach are good. The general trend of the data is interpolated, and the spreading ridge is clearly present in the model, which is not the case with Laplacian interpolation. Since this method only deals with the merged tracks, another method which uses the two track sets separately is tested next.

In this second method, the following fitting goals are solved:
   \begin{eqnarray}
\bold{A_{a}(m-d_{a})} &\approx& \bold 0 \nonumber \\  \bold{A_{d}(m-d_{d})} &\approx& \bold 0,\end{eqnarray}
(5)
where A_a and A_d are again 1D PEFs that are estimated in the data space, which is now two panels containing separately gridded ascending and descending tracks, represented by d_a and d_d. The results for this method are shown in Figure 5.

 
warpfill2a
warpfill2a
Figure 5
Results in a warped space using the fitting goals in equation (5). (a): model obtained after 150 iterations. (b),(c): two parts of the residual space. The data space contains the two sets of tracks, and is twice the size of the model space.
[*] view

The residual space is now twice the size as that for the fitting goals in equation (4), since the ascending and descending tracks are now dealt with separately. This approach appears to also be successful, although some effects of the PEF are present in the data, making the result look like a roughened result. The spreading ridge can be easily delineated. The residual space is interesting to look at, as the influence of the two sets of tracks can be seen in the different portions of the residual. The imprint of the data has disappeared from one half of the residual and has appeared in the other.


next up previous print clean
Next: Conclusions and Future Work Up: Curry: Regularizing Madagascar: PEFs Previous: Background
Stanford Exploration Project
5/23/2004