

Next: Conclusions
Up: Vlad: V(x,z,)
Previous: Introduction
A simple and efficient way to measure the dispersion of plane waves in
a shot gather has been described by McMechan and Yedlin
. The method transforms a shot gather from
the original (t,x) coordinate system to a (velocity, frequency)
coordinate system, on which velocity can be picked as a function
of frequency for each dispersion mode present in the data. The events to
be analyzed this way must be linear. Surface waves fulfil this
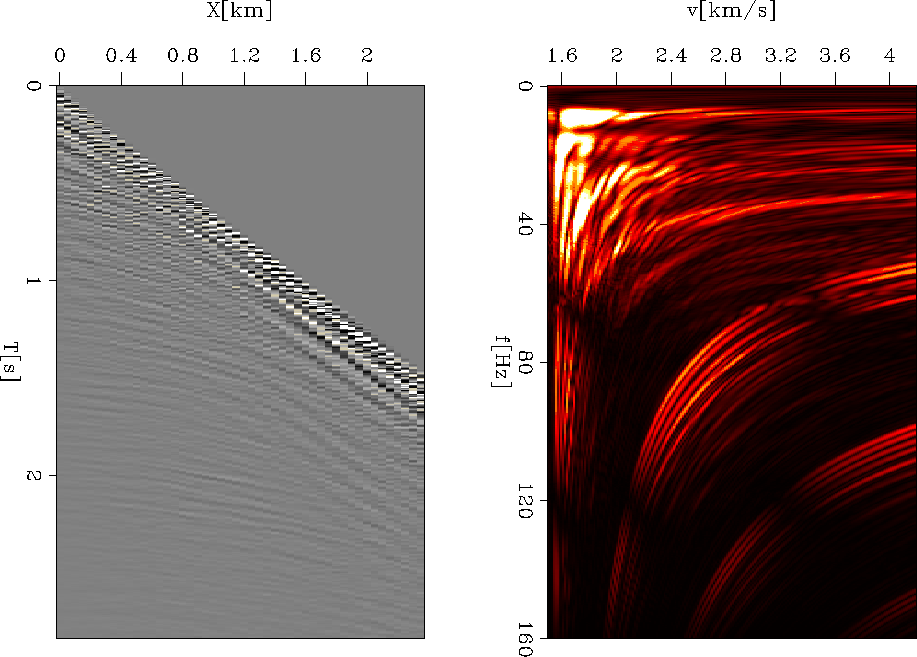
condition. An example of applying this method to a shot gather with
ground roll stronger than the reflections is presented in Figure
![[*]](http://sepwww.stanford.edu/latex2html/cross_ref_motif.gif) . The method consists of two steps: first the shot gather is
slant-stacked, then it is Fourier-transformed along the time axis to
obtain the power spectrum.
. The method consists of two steps: first the shot gather is
slant-stacked, then it is Fourier-transformed along the time axis to
obtain the power spectrum.
To investigate whether reflected events are dispersive, I transform hyperbolas (from a CMP gather this time, not from a shot
gather) into straight lines using a T2 - X2 stretch. Linear event slopes
will correspond to RMS velocities. I then apply the
previously described algorithm for transforming the gather into an
easy-to-pick (velocity, frequency) panel.
In practice, however, transforming to T2 - X2 coordinates then
slant stacking is equivalent to summing along hyperbolic paths - a
bare-bones Radon transform with no amplitude corrections. This cuts
the cost in half and is the way I implemented it. Similar hyperbolic
Radon transforms were used in velocity analysis, but they have been
replaced in common practice by semblance panels. To obtain a semblance
panel, instead of summing along hyperbolas, a statistical measure of
coherence is computed along them. Feeding such a semblance
panel into the dispersion analysis flow did not show
improvement. The mathematics of the McMechan and Yedlin (1980)
method seem to be geared towards actual summations along
velocity-dependent paths. Deconvolution
(which usually improves velocity analysis) did not result in visible
changes either, which means that predictive deconvolution with the same filter for
all traces in the dataset did not affect dispersion.
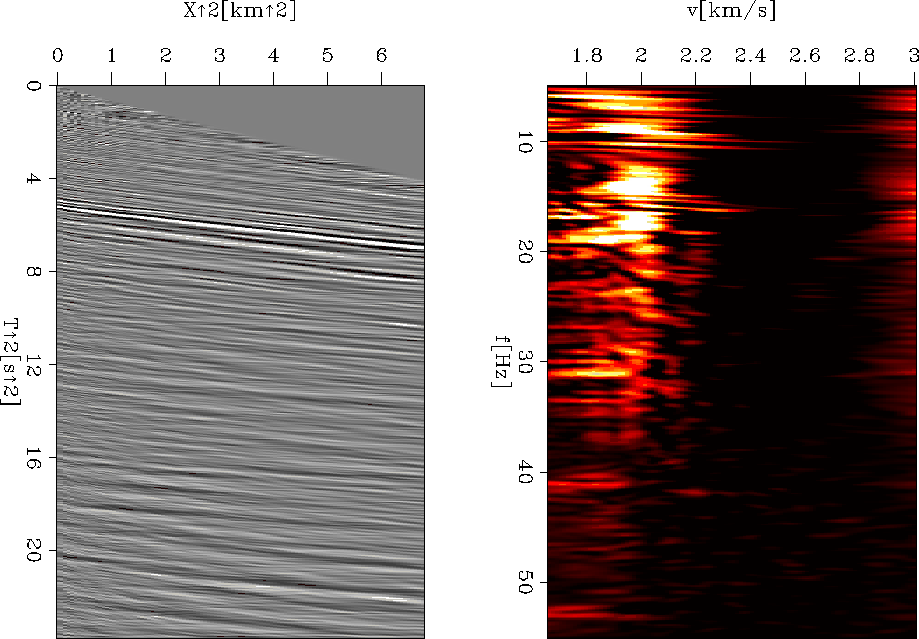
The results (bandpassed to eliminate DC components) are presented in
Figure ![[*]](http://sepwww.stanford.edu/latex2html/cross_ref_motif.gif) . Dispersion curves are much less visible than in
the case of surface waves, but this may be because
the number of reflections in the left panel of Figure
. Dispersion curves are much less visible than in
the case of surface waves, but this may be because
the number of reflections in the left panel of Figure ![[*]](http://sepwww.stanford.edu/latex2html/cross_ref_motif.gif) is considerably greater than the number of
distinct linear events in the left panel of Figure
is considerably greater than the number of
distinct linear events in the left panel of Figure
![[*]](http://sepwww.stanford.edu/latex2html/cross_ref_motif.gif) . This may lead to mutually destructive interference in the dispersion
analysis panel. The inferable trend does not warrant a variation in
velocity of more than 100m/s across the reflection seismic frequency
spectrum. These conclusions from a single Mississippi Delta 2-D
line cannot
be generalized to all seismic reflection data. However,
I did not find any literature or anecdotal evidence pointing
to variations in body wave velocity of more than 100 m/s across the useful reflection seismic frequency range.
. This may lead to mutually destructive interference in the dispersion
analysis panel. The inferable trend does not warrant a variation in
velocity of more than 100m/s across the reflection seismic frequency
spectrum. These conclusions from a single Mississippi Delta 2-D
line cannot
be generalized to all seismic reflection data. However,
I did not find any literature or anecdotal evidence pointing
to variations in body wave velocity of more than 100 m/s across the useful reflection seismic frequency range.
trytool
Figure 1 Example of applying the
McMechan and Yedlin (1980) dispersion analysis method. Left:
input shot gather. Right: output dispersion panel. Curved events
represent various dispersion modes for surface waves. Other events correspond to different arrivals in
the data (direct arrival, reflections, etc.).


 petrix
Figure 2 Application of the
McMechan and Yedlin (1980) dispersion analysis method to a CMP
gather from which the surface waves have been eliminated by muting and
f-k filtering. Left: virtual input. Right: output of the method. The
frequency range is different from Figure ![[*]](http://sepwww.stanford.edu/latex2html/cross_ref_motif.gif) because the
data has been processed to highlight reflections and eliminate surface
waves.
because the
data has been processed to highlight reflections and eliminate surface
waves.


Next: Conclusions
Up: Vlad: V(x,z,)
Previous: Introduction
Stanford Exploration Project
10/14/2003
![[*]](http://sepwww.stanford.edu/latex2html/cross_ref_motif.gif) . Dispersion curves are much less visible than in
the case of surface waves, but this may be because
the number of reflections in the left panel of Figure
. Dispersion curves are much less visible than in
the case of surface waves, but this may be because
the number of reflections in the left panel of Figure ![[*]](http://sepwww.stanford.edu/latex2html/cross_ref_motif.gif) is considerably greater than the number of
distinct linear events in the left panel of Figure
is considerably greater than the number of
distinct linear events in the left panel of Figure
![[*]](http://sepwww.stanford.edu/latex2html/cross_ref_motif.gif) . This may lead to mutually destructive interference in the dispersion
analysis panel. The inferable trend does not warrant a variation in
velocity of more than 100m/s across the reflection seismic frequency
spectrum. These conclusions from a single Mississippi Delta 2-D
line cannot
be generalized to all seismic reflection data. However,
I did not find any literature or anecdotal evidence pointing
to variations in body wave velocity of more than 100 m/s across the useful reflection seismic frequency range.
. This may lead to mutually destructive interference in the dispersion
analysis panel. The inferable trend does not warrant a variation in
velocity of more than 100m/s across the reflection seismic frequency
spectrum. These conclusions from a single Mississippi Delta 2-D
line cannot
be generalized to all seismic reflection data. However,
I did not find any literature or anecdotal evidence pointing
to variations in body wave velocity of more than 100 m/s across the useful reflection seismic frequency range.

